Friday, December 21, 2012
Graph of the Day
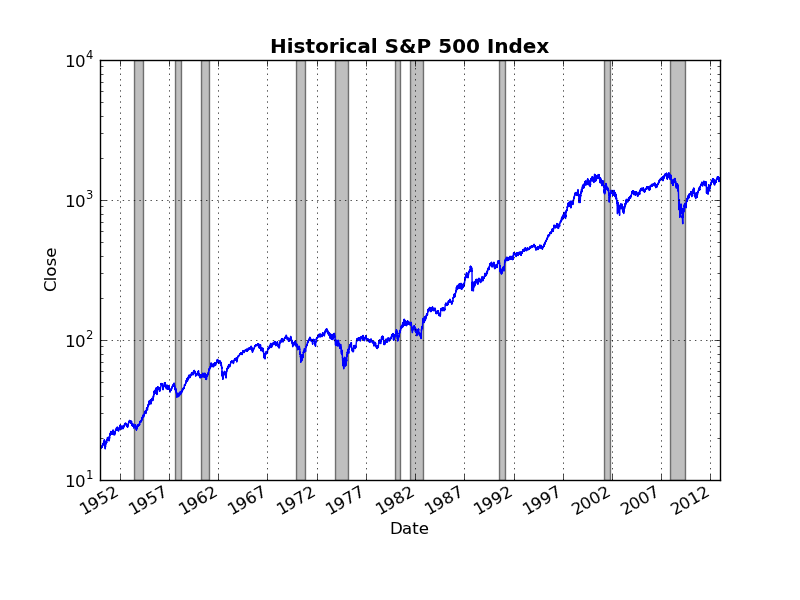
Today's graphic demonstrates the use of Pandas to grab data from Yahoo!Finance. The code I wrote uses pandas.io.get_data_yahoo() to grab historical daily data on the S&P 500 index and then generates a simple time series plot. I went ahead and added the NBER recession bars for good measure. Note the use of a logarithmic scale on the vertical axis. Enjoy!
No comments:
Post a Comment