A nice simple set of lecture slides on computational modeling in the social sciences by Ken Kollman at Michigan (although I have to admit that the uninitiated will probably not find them terribly informative)...also I will have limited to no internet this week...expect fewer than normal posts.
Posting will resume apace from Edinburgh next Monday...
Monday, August 30, 2010
Friday, August 27, 2010
Let Them Eat Credit...
A very nice article entitled "Let The Eat Credit" by Raghuram Rajan of Chicago in the New Republic. Krugman provides a counter to Rajan's assertion that it was predominately government policy mistakes that encouraged the housing bubble...Krugman blames loan originators in the private sector. I say both are right. Krugman's data may support the view that private sector housing market players were more at fault...but I do not think that this absolves the government from engaging in the type of short-sighted policies to address income inequality(i.e., credit, credit, and more credit) that Rajan writes about in his article.
Computational Approaches to Network Formation...
The third major component of my first year of PhD research will focus on computational approaches to financial network formation. Prof. Leigh Tesfatsion has created an excellent bibliography of the literature in this area.
Quote of the Day...
"To someone schooled in nonlinear dynamics, economic time series look very far from equilibrium, and the emphasis of economic theories on equilibria seems rather bizarre. In fact, the use of the word equilibrium in economics appears to be much closer to the notion of attractor as it is used in dynamics rather than any notion of equilibrium used in physics."
-J. Doyne Farmer, 1988
Thursday, August 26, 2010
First Section of Lecture Notes on Geometry of Linear Regression...
This is my first cut of lecture notes on the Geometry of Linear Regression...FYI the b and beta are the same...having html issues. Hopefully I have not made any egregious errors...
The Geometry of Linear Regression
Suppose we have the following system of equations:
y=Xb
Here the dependent variable y is a vector of length m, X is our (m x n) matrix (i.e., m rows and n columns, typically m>n) of independent variables, b is a vector of coefficients of length n. Why are we going to start by talking about the geometry of solutions to systems of linear equations? Well, because at a fundamental level linear regression is really all about "solving" a system of linear equations when there is no true solution. Linear regression finds a solution b to our system of equations that is the "best" because it is "closest" in a very specific way to the vector y.
Now our system of m equations with n unknowns (the n coefficients which comprise the vector b) tells us that the vector y (our dependent variable) is a linear combination of the columns of X (our independent variables)….
Now our system of m equations with n unknowns (the n coefficients which comprise the vector b) tells us that the vector y (our dependent variable) is a linear combination of the columns of X (our independent variables)….
y= b1x1 + b2x2 + … + bnxn
Here xi i=1,…n are the column vectors of length m that make up the matrix X. This means that the vector y is in the column space, col(X), of our matrix X. In pictures with 2 independent variables…notice that the our independent variable, the vector y, lies in the plane corresponding to the col(X)

Remember from its definition that the col(X) is the vector space spanned by the column vectors of X, which is simply a fancy way of saying that the col(X) includes all linear combinations of the column vectors of X (which includes y at this point). If the column vectors, our dependent variables, also happen to be linearly independent of one another then our column vectors form a basis for the col(X). Normally this will be the case…but it is crucial that our set of dependent variables be independent of one another!
If we have nice case: X is an (m x n) matrix with m>n and that our columns of X, which span the col(X) by definition, are linearly independent of one another and thus also form a basis for the col(X). This implies that the rank of X (which as you will remember is simply the number of linearly independent columns of X) and the dimension of col(X) (which is simply the number of vectors needed to form the basis of col(X)) are both equal to n. Our matrix has full column rank! We are off to a good start…
Let’s Talk About Correlation…
Geometrically, correlation between two variables (which we are representing as vectors) is related to the angle between two variables/vectors via the following formula…

Cosine! Theta! Dot products and Euclidian Norms! Boo! Let’s draw pictures…In this first picture our two independent variables are positively (negatively) correlated because the angle between their two corresponding vectors in the col(X) is acute (obtuse). I draw the positively correlated case below…

In this second picture, the two vectors are at right angles with one another and are therefore uncorrelated. This is an extremely important case…when you are learn about OLS, IV and GLS the question of whether or not your error term is uncorrelated with your explanatory (i.e., independent) variables will come up again and again…remember, geometrically, uncorrelated mean vectors at right angles!

Finally what does it look like if the two vectors are perfectly positively (negatively) correlated with one another? Although I will leave it up to you to draw your own picture, for the perfectly positively correlated case look at the picture of the acute case and think about what happens as the angle gets really, really small. Once you figure that out and get your picture, the perfectly negatively correlated case is simply the 180-degree (hint) opposite…
Still Watching Linear Algebra...
Wednesday, August 25, 2010
Idea About Regulatory Policy Design...
Fair use warning!!! Totally speculative blog post...
In my last post I mentioned that a major difficulty for policymakers in designing regulatory policy was how to develop a framework to mitigate systemic risk in an environment where there is a trade-off between mitigating individual risk and systemic risk. I have an idea...
Study the evolution of communities of agents within the financial sector using network data and some set of risk measures. In theory, at least, the agents within these evolving community structures should be affected by some common key drivers of individual risk (given that they are in the same community). Then try to develop a regulatory framework that encourages the individuals within communities to mitigate community risk...the idea is that this difficult coordination task would be made easier given that the agents are affected by a common set of risk drivers.
This idea implicitly assumes that, in terms of mitigating systemic risk, mitigating risk individually at the community level is somehow better than mitigating risk individually at the level of the individual agent. But is there any basis for this belief? I have no idea...perhaps this idea is only a good one insofar as it makes the policymakers job easier...but I am not even convinced it does...
Major Insight of the Literature on Financial Networks...
Keshav passed along some links to papers on financial networks that are being presented at the EEA conference that he is attending. I have glanced over the abstracts from the papers that and they all remind/reinforce what I think is the major insight from the networks literature on systemic risk in the financial sector that was extremely under appreciated until very recently:
Individuals agents in the financial sector who are rationally pursuing strategies that minimize their individual idiosyncratic financial risks can actually cause substantial increases in overall/systemic risk in the financial sector. If individual agents and their risk mitigation strategies existed independently of one another (i.e., did not interact) then minimizing their risks individually would surely (I think) lead to a minimization of systemic risk as well. The key issue that the network literature focuses nicely on is that financial agents and their strategies do interact with one another and that these interactions can create both stabilizing and destabilizing (depending on circumstances) feedback effects. Oftentimes the destabilizing feedback effects dominate...
Generally speaking I think most policy makers would have assumed that a regulatory/incentive structure in the financial system that encouraged all players to mitigate individual risk would also be a good regulatory framework for mitigating systemic risk. Based on recent empirical evidence and research I would say that this notion should be discredited...Given that there seems to be a trade-off between mitigating individual and systemic risk, the hard part from a policy perspective is how do you a design a regulatory regime that encourages mitigation of some weighted average of individual vs. collective/systemic financial risk.
Different papers in the financial networks literature look at a variety of specific issues that relate to systemic risk, but ultimately it is the trade-off between mitigating individual risk and mitigating systemic risk that continues to emerge. Maybe I am wrong about my interpretation of the literature...but for me at least, this has been my major takeaway...
Tuesday, August 24, 2010
Watching More Linear Algebra Lectures...
In the original link I sent out with the 35 MIT lectures on Linear Algebra, lecture 8 on Solving Ax=b and the Row Reduced Form R is corrupted. You can find the whole (or at least most of the series) on Google Video. Here is a working link to for lecture 8...
The Visa Process, Cont'd...
Passport and UK Student Visa arrived in the mail today from British Consulate. I am now good to go...
Monday, August 23, 2010
A Visual Approach to OLS...
As I am prepping for my teaching requirements for the upcoming year, I have been thinking about employing a more visual/geometric approach to OLS. I remember sitting in a lecture on GMM where the professor was talking about projection matrices and all of the sudden something just clicked. I recall thinking: "Wow, the different versions of regression analysis (i.e., OLS, GLS, IV, etc) can be thought of as projections of the dependent variable (y) onto the column space spanned by the regressors (Xs)." When you multiply the vector y by the projection matrix P = X(X′X)−1X′ you project the vector y onto the space spanned by the columns of X and the result is shown in the diagram below.
The matrix Xβ is simply a linear combination of the columns of X (i.e., a linear
combination of the regressors) and as such lies in the column space of X. The idea
behind OLS is to then simply choose the right β so that the linear combination will
minimize the distance between the vector y and its projection in the column space of X.
Additionally it is straightforward to extend this framework to talk about issues related
to correlation between regressors, errors, etc.

I would like to emphasize this projection interpretation to my introductory statistics and econometrics students. Although this approach does use some basic jargon borrowed from linear algebra (most of which they are already required to know)...I think/hope that it will be more intuitive for the students.
Cobb-Douglas Applet...
Useful JAVA applet that helps visualize Cobb-Douglas production function in 3-D. Would be useful for students trying to understand the relationship between increasing, decreasing, or constant returns to scale, and the shape of marginal returns...
Sunday, August 22, 2010
Watching Linear Algebra Lectures...
I was watching MIT Linear Algebra lectures 3-Multiplication and Inverses, and 4-Factorization into A=LU and 10 minutes into lecture 4...the tape quit! Damn! Factoring a matrix A into the product of a lower triangular matrix L and an upper triangular matrix U is a pretty useful thing to know how to do. It makes calculating things like trace, determinants, and inverses of A really easy...
Alas...it is a good thing that I already new how to do the factorization...but here is a link to the video lecture that will work...the link takes you to a series of written notes based on the MIT lecture series which is also quite useful...
Alas...it is a good thing that I already new how to do the factorization...but here is a link to the video lecture that will work...the link takes you to a series of written notes based on the MIT lecture series which is also quite useful...
Saturday, August 21, 2010
Bibliography of Networks...
For anyone else interested in networks I have found a fairly extensive bibliography courtesy of the Stern School at NYU.
Friday, August 20, 2010
Teach Yourself Linear Algebra in a Day and a Half...
35 lectures on linear algebra from MIT Professor Gilbert Strang. Start with "The Geometry of Linear Equations" and end with "Final Course Review." I am on lecture two: "Elimination with Matrices." I had two course on linear algebra as an undergrad and the subject played a starring role in my MSc. I am prepping for TAing Quantitative Methods courses this year, and I am finding these lectures to be a nice refresh...
Thursday, August 19, 2010
More on my PhD Research Agenda...
The following papers are going to form my point of departure for my PhD research:
- Liaisons Dangereuses: Increasing Connectivity, Risk Sharing, and Systemic Risk-This paper by Battiston et al has all of the ingredients that I am interested in studying (specifically credit networks and their relationship to systemic risk). An excellent slide deck that covers the key concepts and conclusions of the paper can be found here. In their model, as the network becomes more dense (i.e., more inter-connected) individual risk decreases because more connections allow each individual to diversify idiosyncratic shocks. However, increasing network density also increases the ability of negative shocks to propogate through the entire network (instead of being locally contained) and thus leads to an increase in systemic risk.
- Financially Constrained Fluctuations in an Evolving Network Economy-This paper by Delli Gatti et al is a nice model of credit networks between firms and banks. It includes both inside or trade credit as well as outside or bank credit. The interaction effects of the firms financial positions generates business cycles (similar to Minsky's financial instability hypothesis). Model simulations also replicates power law distribution of firm sizes and Laplace distribution of firms' growth rates.
- Econometric Measures of Systemic Risk in the Finance and Insurance Sectors-This paper by Billio et al suggests some possible practical applications of the network approach to systemic risk analysis.
Wednesday, August 18, 2010
Even More Economics 101 by Brad DeLong...
Another must read for those of us teaching/tutoring intro macroeconomics...
The Hidden Hazards of Adaptive Behavior...
James passed me this interesting paper on the stability of multivariate systems where agents use adaptive behavior via email. I did a quick read...heavy on the maths (although I think it is mostly just multivariate calculus and linear algebra). They also went all out on the notation...I haven't seen some of those symbols outside of formal advanced maths texts. It would take quite a bit of work for me to fully grasp the paper as I would need to follow through on the calculations etc. Although plowing through the maths would be a good refresher...
I think his (i.e., James') characterization of the paper in the email is pretty much on target. They seem to formally develop general conditions under which multivariate systems with adaptive expectations are not stable. They find that for the most part, such systems are not stable. And they stress that their results provide further evidence that equilibrium stability results from models where homogeneous agents are using adaptive behavior (or that are otherwise one-dimensional) should not be generalized to high dimensional or heterogeneous agent models where agents are using adaptive behavior. The study of multivariate (and heterogeneous agent) systems, would seem to be a study in disequilibrium behavior...
Their results support the other research on multivariate and complex adaptive systems that I have read. From my reading of the literature, multivariate systems (including heterogeneous agent systems), generally speaking, are not stable. At least in the sense that it is rare that such complex systems settle down to some static equilibrium. On the other hand many multivariate and complex adaptive systems do exhibit endogenous self-organizing behavior (which I like to think of as a type of stable disequilibrium behavior...although this may not be the best choice of words to capture the phenomenon), punctuated equilibrium dynamics, etc.
The more I learn about economics, the more I am becoming convinced that economics is not an equilibrium science. Economics is fundamentally a science of disequilibrium behavior. I will go out on a limb here and say that perhaps one of the reasons that economics, particularly macroeconomics, has struggled so much is because we as economists are trying to force our (for the most part) linear equilibrium models to describe a non-linear disequilibrium world...
There is also the (I'd like to think small) possibility that I am cocooned in a world of complex adaptive systems, and am suffering from a massive case of confirmation bias...
Tuesday, August 17, 2010
Quote of the Day...
"That's you...drops of water. And you're on top of the mountain of success. But one day you start sliding down the mountain and you think wait a minute I'm a mountain top water drop and I don't belong in this valley...in this river...in this little dark ocean with all these other drops of water. Then one day it gets hot, and you slowly evaporate into the air. Way up. Higher than any mountain top. All the way to the heavens. Then you understand that it was when you were at your lowest that you were closest to god. Life's a journey that goes round and round and the end is closest to the beginning. So if its change you need...relish the journey."
-Some guy
Linking Liquidity Constraints to Network Formation...
For some time now I have been struggling to develop a mechanism to link liquidity constraints with the agent's network formation decision. I suspect that this has a lot to do with the fact that while I have read quite a lot on network theory, I have not yet got around to reading much of anything having to do with liquidity constraints. All of my knowledge of liquidity constraints has come from the two weeks we spent talking about them during my MSc. What follows is my first attempt to link the two concepts together. The idea follows closely to the textbook treatment of consumption decisions of agents facing liquidity constraints.
The agent has two choice variables each time period: consumption, ct, and the number of neighbors in the network, nt. The agent has wealth wt and anticipates some uncertain future income yt+1. This agent's savings can be defined to be st=wt-ct. Typically an agent then maximizes something like the sum of his current utility plus the expected discounted sum of future utility subject to the constraint that next period's wealth wt+1=Rt+1(st+yt+1), where Rt+1 is the interest rate. A liquidity constraint in this scenario would require that the agent's savings st be non-negative (i.e., agents can not borrow).
What I want to do is allow agents to borrow funds from neighbors in the network (assuming that they have excess savings to lend). Agents would become liquidity constrained if neither themselves nor any of their neighbors had funds to lend them. In this scenario, an agent's consumption decisions over time are affected by his position in the network (i.e., his access to credit from his neighbors). Clearly there are a number of issues to work out with the framework. Such as how to specify the interest rate, the income stream, the appropriate utility function, the information set, etc. Also this is definitely not going to be analytically tractable (but them neither are more traditional liquidity constraint problems). Ideally it would also be nice to be able to model agent default. Maybe this could be done by specifying some type of stochastic income stream where there is some positive probability of the agent unexpectedly ending up in the "low" income state and is thus unable to repay his loan.
This is pretty much wild speculation at this point...I just wanted to get these thoughts down on digital paper...
Monday, August 16, 2010
The Terrible Flooding in Pakistan...
Some sobering photos . The severity of the situation would seem to call for aggressive international response...
Friday, August 13, 2010
More Economics 101 from Brad DeLong...
Follow-up to earlier post. Follow the link to read a draft of Brad DeLong's second intro economics lecture...
Origin of Wealth Slidedeck...
An excellent summary of Eric Beinhocker's Origin of Wealth: Evolution, Complexity, and the Radical Remaking of Economics courtesy of the UK Cabinet Office.
I just finished reading Origin of Wealth, and I would highly recommend it to anyone interested in a nice summary of the complex adaptive systems approach to economics. Although the book is directed to a lay audience (i.e., not academic economists) the footnotes, endnotes, and references are excellent and direct the more technical reader to the appropriate papers for more detailed discussion and analysis.
I just finished reading Origin of Wealth, and I would highly recommend it to anyone interested in a nice summary of the complex adaptive systems approach to economics. Although the book is directed to a lay audience (i.e., not academic economists) the footnotes, endnotes, and references are excellent and direct the more technical reader to the appropriate papers for more detailed discussion and analysis.
The Visa Process, Cont'd...
The UK Visa Office has refunded the $311 fee that I paid for my original visa application that they mistakenly deleted. I must say I am shocked...and also extremely impressed. Well done...
Thursday, August 12, 2010
Quote of the Day...
"Government's view of the economy could be summed up in a few short phrases: If it moves, tax it. If it keeps moving, regulate it. And if it stops moving, subsidize it."
-Ronald Reagan, Address to the White House Conference on Small Business (1986)
1st Year of my PhD (A Rough Outline)...
As my PhD studies approach I have been thinking about how best to structure my first year to make sure that it is in line with my overall PhD agenda. Here is my first attempt:
1st Year Topic of Focus: Formation of Credit Networks
Need to build at least two small-scale, analytically tractable models (i.e., solvable via pen & paper)of credit network formation. Goal is to build intution and gain a deeper understanding of how credit effects network incentives. There are two main approaches to explore:
- Traditional utility-based approach to credit network formation. Analysis will rely heavily on game threory. Equilibrum concept will be some version refinement of Nash. Work will rely heavily on previous research by Jackson, Goyal, Vega-Redondo, et al.
- Random network approach to credit network formation. Relies heavily on research done by Jackson, Barabasi and Albert, et al. Analytical techniques borrow heavily from statistical physics.
- I will need to establish relationships with the School of Informatics in order to develop my programming skills to the point where I can write and compile my own code. Programming is especially important as I will be applying to the Sante Fe Institute's Summer School in 2011.
- Also I need to continue to develop my EVT skills. Much of this can actually be done in conjunction with my responsibilities as a QM tutor and TA.
Economics 101 from Brad DeLong...
Nice first-draft of Economics 101 lectures by Brad DeLong. Well worth a glance through for those of us likely to be tutoring students in intro macro this year.
Wednesday, August 11, 2010
How U.S. Economic Policy is Formed...
Thanks to Greg Mankiw for the pointer. Interesting inside gouge on how the major players in U.S. economic policy are connected by Keith Hennessey...
α-Stable Distributions and Extreme Value Theory...
Below is a slightly edited excerpt from my MSc Thesis...
In many critical real-world situations the events that are of most concern to the economic policy-maker are those events that have low-probability, high-impact events. Extreme Value Theory (EVT) is the branch of statistical theory that deals primarily with developing techniques to accurately (and more importantly consistently) estimate the shape of the extreme quantiles or tails of a distribution. As the only class of limiting distributions for sums of i.i.d. random variables, α-stable distributions play a central role in a branch of statistics known as Extreme Value Theory (EVT). However, the central result of Extreme Value Theory is the Fisher-Tippet theorem describing the limit behavior of the maxima, Mn, of an i.i.d sequence {Xn}.
The Fisher-Tippet Theorem says the following: given a sequence {Xn} of i.i.d random variables drawn from some common distribution F, define M1=0 and Mn=max{X1,…,Xn} for n≥2 (this is just a sequence of maximum events). If the distribution of Mn (after being appropriately re-centered and re-scaled) converges to some non-degenerate limit distribution H as n gets “large,” then H must be one of the following three distributions: the Fréchet, the Weibull, or the Gumbel.
These three distributions are known collectively as the Extreme Value Distributions and can be expressed by a single distribution called the Generalized Extreme Value (GEV) distribution Hξ. The parameter ξ defines the shape of the distribution in terms of tail “thickness.” The case where the shape parameter ξ>0 (“fat-tails”) corresponds to the Fréchet distribution, ξ=0 (“thin-tails”) corresponds to the Gumbel distribution, and when ξ<0 (“bounded-tails”) Hξ is the Weibull distribution.
In sum, as a result of some mathematical jiggery-pokery if we are interested in how extreme economic "events" behave, we can focus our attention on trying to fit one of the three Extreme Value distributions to the extreme events in our economic time series data.
Key Assumptions: Although the Fisher-Tippet theorem was derived for i.i.d. sequences, the convergence result also holds under fairly mundane regularity conditions and under less stringent assumptions than independence. The key assumption that is required for the Fisher-Tippet theorem to hold is stationarity (i.e., the parameters of H are independent of time). Unfortunately for applications of EVT, the assumption of stationarity is often violated in real-world data. This is particularly relevant for economic data where stationarity of the data generating process (DGP) for our economic events would require that the “true” DGP for generating economic events also not change through time. For a process as highly adaptive as that of economic activity, stationarity is simply not plausible (regardless of the result of formal statistical tests for time-series stationarity). When dealing with non-stationary data, current practice dictates that the researcher introduces time dependence in the extreme value parameters.
Crazy Side Note: It is my belief that there are two classes of non-stationary DGPs. Class-I non-stationary DGPS are those whose parameters are well described by some deterministic or mildly stochastic function of time. In this situation, assuming that one correctly models the function describing the non-stationary behavior, techniques exist to estimate the relevant parameters and derive confidence intervals. A key implicit assumption used to estimate Class-I non-stationary series is that the functional form that determines how the parameters change with time is, itself, time invariant. If this implicit assumption is valid, then this would justify the use of historical data to forecast future events.
Class-II non-stationary DGPs, on the other hand are those whose parameters are constantly changing with time due to some underlying adaptive process. In this case even if one is willing to assume that the adaptive process can be modeled by some combination of deterministic and mildly stochastic components, the key implicit assumption of time invariance of the assumed functional form is clearly violated. If one is dealing with a class 2 non-stationary DGP, then use of historical data to forecast future events is highly questionable. Unfortunately, for us economists, the DGP for economic events is likely Class-II non-stationary.
References:
Fat-Tails and α-Stable Distributions: There is now a large, and growing, body of literature documenting the “fat-tail” properties of a number of economic variables (i.e., stock returns, oil and other commodity prices, income, exchange rates, etc.) In the event that the "fat-tail" of a given variable follows a power law, such variables may be well described by α-stable distributions. Such distributions are sometimes also referred to as α-Levy stable distributions after the mathematician Paul Levy who first characterized the class of distributions in 1924 as part of his study of normalized sums of i.i.d. terms. An intriguing property of α-stable distributions is that they will often exhibit an infinite variance. Seminal work in applying α-stable distributions to economic variables, stock prices and commodity prices, is Fama (1963, 1965a, 1965b) and Mandlebrot (1961, 1963, 1967).When I wrote this section of my thesis, I was more than a little bit enthralled with power laws and infinite variance (I blame it on too much time reading Taleb's the Black Swan). Some caveats about what I wrote above based on what I have learned in the past year:
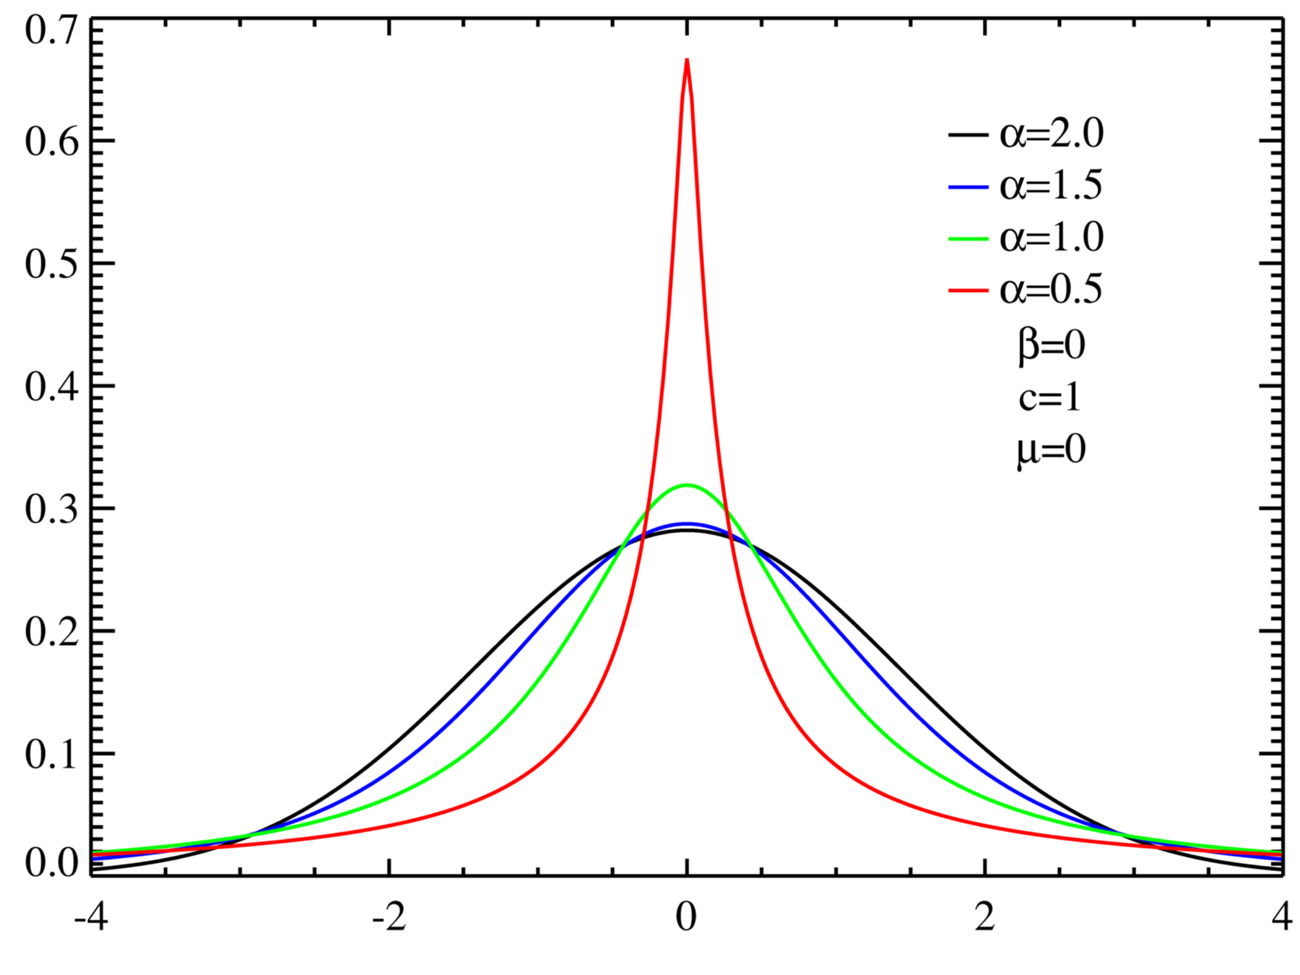
α-Stable distributions are described by four parameters:
The class of α-stable distributions encompasses the more well known normal (Gaussian) and Cauchy distributions as special cases. The stable distribution with α=1 corresponds to the Cauchy distribution, whereas the case α=2 corresponds to a normal distribution. It is important to note that α-stable distributions with α<2 have an infinite variance, and that therefore the normal (Gaussian) distribution is the only stable distribution that has a finite variance. Figure A.1 presents density plots of symmetric (β=0), centered (μ=0) α-stable distributions for α=0.5, 1.0, 1.5, 2.0. Note that in all cases the distributions have a unit scale factor (c=1). The case α=2.0 corresponds to the normal (Gaussian) distribution. The “fat-tail” behavior of α-stable distributions can easily be seen in Figure A.1.
- α - the stability parameter (sometimes called the index of stability or characteristic exponent), which takes values in the range (0,2]
- β - a skewness parameter which takes values [-1,1]. If β>0 the distribution is skewed to the right, while if β<0 the distribution is skewed to the left.
- c - a scale parameter which takes values (0, +∞)
- μ - a location parameter which takes values (-∞, +∞). The location parameter shifts the entire distribution to the right if μ>0 and to the left if μ<0.
Figure A.1: Theoretical Density plots of various α-stable distributions
The α-stable distributions are intimately connected to Pareto (power law) distributions: the tails of α-stable distributions are asymptotically Pareto (power law) distributed. Power laws turn up quite frequently in economics. Gabaix (2009) is an excellent review of power law distributions, their applications in economics, and their relationship to “fat-tail” behavior.
Why work with a distribution with an infinite variance? There are three reasons main reasons why one might want to use α-stable distributions in a model (Nolan 2009). First, there may be sound theoretical reasons to expect a particular economic process to be non-normal (Gaussian). Gabaix (2009) provides several theoretical applications in economics and finance. The second reason is that α-stable distributions have their own central limit theorem. The Generalized Central Limit Theorem, as stated in Nolan (2009), says that the only possible non-trivial limit of normalized sums of i.i.d terms must be an α-stable distribution. The third reason is empirical. As mentioned above there is a growing body of research documenting the “fat-tails” and skewness of many economic variables. The class of α-stable distributions allows the researcher to parsimoniously account for both the “fat-tail” and skewness characteristics of the data.
- Power Law behavior implies fat-tails, but fat-tails doesn't necessarily imply power law behavior.
- Just because a variable exhibits linear behavior when plotted on log-log scales, doesn't mean that it follows a power law.
- Even if you find that your variable does follow a power-law, this doesn't necessarily mean that it is well described by a stable distribution.
- Even if you find that your variable does follow a power-law, this doesn't mean that it must also have an infinite variance.
In many critical real-world situations the events that are of most concern to the economic policy-maker are those events that have low-probability, high-impact events. Extreme Value Theory (EVT) is the branch of statistical theory that deals primarily with developing techniques to accurately (and more importantly consistently) estimate the shape of the extreme quantiles or tails of a distribution. As the only class of limiting distributions for sums of i.i.d. random variables, α-stable distributions play a central role in a branch of statistics known as Extreme Value Theory (EVT). However, the central result of Extreme Value Theory is the Fisher-Tippet theorem describing the limit behavior of the maxima, Mn, of an i.i.d sequence {Xn}.
The Fisher-Tippet Theorem says the following: given a sequence {Xn} of i.i.d random variables drawn from some common distribution F, define M1=0 and Mn=max{X1,…,Xn} for n≥2 (this is just a sequence of maximum events). If the distribution of Mn (after being appropriately re-centered and re-scaled) converges to some non-degenerate limit distribution H as n gets “large,” then H must be one of the following three distributions: the Fréchet, the Weibull, or the Gumbel.
These three distributions are known collectively as the Extreme Value Distributions and can be expressed by a single distribution called the Generalized Extreme Value (GEV) distribution Hξ. The parameter ξ defines the shape of the distribution in terms of tail “thickness.” The case where the shape parameter ξ>0 (“fat-tails”) corresponds to the Fréchet distribution, ξ=0 (“thin-tails”) corresponds to the Gumbel distribution, and when ξ<0 (“bounded-tails”) Hξ is the Weibull distribution.
In sum, as a result of some mathematical jiggery-pokery if we are interested in how extreme economic "events" behave, we can focus our attention on trying to fit one of the three Extreme Value distributions to the extreme events in our economic time series data.
Key Assumptions: Although the Fisher-Tippet theorem was derived for i.i.d. sequences, the convergence result also holds under fairly mundane regularity conditions and under less stringent assumptions than independence. The key assumption that is required for the Fisher-Tippet theorem to hold is stationarity (i.e., the parameters of H are independent of time). Unfortunately for applications of EVT, the assumption of stationarity is often violated in real-world data. This is particularly relevant for economic data where stationarity of the data generating process (DGP) for our economic events would require that the “true” DGP for generating economic events also not change through time. For a process as highly adaptive as that of economic activity, stationarity is simply not plausible (regardless of the result of formal statistical tests for time-series stationarity). When dealing with non-stationary data, current practice dictates that the researcher introduces time dependence in the extreme value parameters.
Crazy Side Note: It is my belief that there are two classes of non-stationary DGPs. Class-I non-stationary DGPS are those whose parameters are well described by some deterministic or mildly stochastic function of time. In this situation, assuming that one correctly models the function describing the non-stationary behavior, techniques exist to estimate the relevant parameters and derive confidence intervals. A key implicit assumption used to estimate Class-I non-stationary series is that the functional form that determines how the parameters change with time is, itself, time invariant. If this implicit assumption is valid, then this would justify the use of historical data to forecast future events.
Class-II non-stationary DGPs, on the other hand are those whose parameters are constantly changing with time due to some underlying adaptive process. In this case even if one is willing to assume that the adaptive process can be modeled by some combination of deterministic and mildly stochastic components, the key implicit assumption of time invariance of the assumed functional form is clearly violated. If one is dealing with a class 2 non-stationary DGP, then use of historical data to forecast future events is highly questionable. Unfortunately, for us economists, the DGP for economic events is likely Class-II non-stationary.
References:
- Fama, E. 1963. “Mandelbrot and the Stable Paretian Hypothesis.” Journal of Business 36(4), 1963, 420–429.
- Fama, E. “Portfolio Analysis in a Stable Paretian Market.” Management Science 11(3A), 1965a, 404–419.
- Fama, E. “The Behavior of Stock Market Prices.” Journal of Business 38(1), 1965b, 34–105.
- Gabaix, Xavier. “Power Laws in Economics and Finance.” Annual Review of Economics, 1, 2009.
- Mandelbrot B. “Stable Paretian Random Functions and the Multiplicative Variation of Income.” Econometrica, 29, 1961, 517-43
- Mandelbrot, B. “The Variation of Certain Speculative Prices.” Journal of Business, 36, 1963, 394-419.
- Nolan, J. “Numerical Computation of Stable Densities and Distribution Functions.” Communications in Statistics-Stochastic Models, 15, 1997, 759-774.
- Nolan, J.P. “Stable Distributions – Models for Heavy Tailed Data.” Birkhauser, Forthcoming 2009. (Chapter 1 available online at http://academic2.american.edu/~jpnolan/stable/stable.html.)
Sugarscape Resources...
I am currently working on a slide deck that I plan to use to teach an introductory course in agent-based computational modeling based on Axtell and Epstein's Growing Artificial Societies: Social Science from the Bottom Up (Complex Adaptive Systems) .
.
Below are a list of resources that I have compiled so far for anyone that is interested:
Below are a list of resources that I have compiled so far for anyone that is interested:
- Sugarscape: Netlogo JAVA implementations of Sugarscape models. This implementation has pre-programmed defaults that re-create the animations from Growing Artificial Societies. Also includes some basic documentation and references for those interested in more detail. Drawbacks: I have yet to figure out how to export data generated by the models. I believe it can be done by downloading the Netlogo tool (as opposed to just running the model in a web-browser), but I have not had time to do this yet.
- A nice tutorial from the University of Leicester
- ASCAPE modeling software: JAVA ABM software created by Brookings et al. In addition to implementing a number of well-known ABMs the software allows users to write, compile, and run their own models. Also has the ability to export model-generated data for analysis...which is obviously crucial.
- Modeling software from University of Oxford that implements Sugarscape.
- Related papers: Horres and Gore
The Visa Process, Cont'd
I have been remiss in my blogging duties the past few days...apologies. I was finally able to complete the final part of the visa process, a biometrics appointment with the Department of Homeland Security (DHS), this past Monday. I have mailed my completed application and passport to the British Consulate in New York...now I must play the waiting game.
This is the second time that I have gone through the UK Visa process and I must say that that the current process is considerably streamlined compared to the Visa process I went through 2 years ago. The CAS document (required for all student Visas), in particular, was an excellent innovation that standardizes and reduces the volume of supporting documentation. Biometrics are still the same, DHS collects digital fingerprints and photographs and then share it with UK immigrationn officials for all Visa applicants of any nationality entering the UK via the U.S.
I am should arrive in Edinburgh in early September...
Saturday, August 7, 2010
Quote of the Day...
"If your theory is found to be against the second law of Thermodynamics I can give you no hope; there is nothing for it but to collapse in deepest humiliation."
-Sir Arthur Eddington
Friday, August 6, 2010
Quote of the Day...
"Markets win over command and control, not because of their efficiency at resource allocation in equilibrium, but because of their effectiveness at innovation in disequilibrium."
-Eric Beinhocker, The Origin of Wealth
Is there such a thing as a "benign" deflation...
The Cato Institute thinks so, and has published a paper on the subject. Basically a benign deflation is one that is caused by an increase in aggregate supply (as opposed to the more familiar malign deflation that is driven by a collapse in aggregate demand). They go on to argue that such benign deflations are optimal, etc, etc...
The Cato institute points out that within the standard AD-AS model, deflation can come about following an increase in aggregate supply that are not accomodated by an easing in monetary policy.
The Cato institute points out that within the standard AD-AS model, deflation can come about following an increase in aggregate supply that are not accomodated by an easing in monetary policy.
"Such aggregate supply shocks are the result of positive innovations to productivity or factor input growth that lower per unit costs of production and, in conjunction with competitive market forces, create downward pressure on output prices. Unlike a collapse in aggregate demand, positive aggregate supply shocks that are not monetarily accommodated generate a benign form of deflation where nominal spending is stable, because the decline in the price level is accompanied by an increase in the actual and “natural” level of output."They go on to make the following arguement: if we are experiencing deflation now, then it is clearly the benign form of deflation, that it is optimal, and that governments everywhere shouldn't fight it. They mention something about China and India being positive shocks to aggegate supply I think...to be honest my attention span began to wane...I kept trying to work out how this view could be consistent with the empirically documented high amount of slack/under-utilized capacity in the economy...I am pretty sure that it isn't consistent...but this would not be the first time that the Cato Institute has published something inconsistent with reality but consistent with their political agenda. I don't doubt that deflation driven by an increase in aggregate supply is possible, nor do I doubt that one can find historical examples of such a deflationary event...I do however doubt that a benign deflation is what we are about to experience.
People at NBER are writing portions of my PhD dissertation...
The University of Essex is doing interesting things...
The Centre for Computational Finance and Economic Agents at the University of Essex is doing really interesting work applying large scale agent-based computational modeling to study contagion and systemic risk in the financial sector. The work they have done is highly relevant to what I am hoping to accomplish as part of my PhD research...particularly in year 3 where I hope to build a computational model that ties all of my research on the diffusion of liquidity and the evolution of networks together.
Thursday, August 5, 2010
Teaching the Prisoner's Dilemma...
The Prisoner's Dilemma features prominently in every undergraduate and graduate course in game theory, microeconomics, or international relations. Having had the good fortune to sit through multiple presentations of the Prisoner's Dilemma to a number of different audiences (academic audiences in both undergrad and grad school, private industry, government, etc) I have noticed that the game just doesn't make much sense to people when it is first explained. The audience typically has a hard time understanding why defecting is clearly the dominant strategy...
This is a very rough first draft of notes on the Prisoner's Dilemma that I am hoping to expand into a self contained teaching module at some point...my plan is to develop the module using Joshua Epstein's computational model and ASCAPE software as the major teaching tools. Robert Axtell's The Evolution of Cooperation: Revised Edition is also a major influence.
I think it would help if the initial presentation did not focus so much on the one-shot version of the game. Prisoner Dilemma games can be divided into four distinct classes:
This is a very rough first draft of notes on the Prisoner's Dilemma that I am hoping to expand into a self contained teaching module at some point...my plan is to develop the module using Joshua Epstein's computational model and ASCAPE software as the major teaching tools. Robert Axtell's The Evolution of Cooperation: Revised Edition
I think it would help if the initial presentation did not focus so much on the one-shot version of the game. Prisoner Dilemma games can be divided into four distinct classes:
- The One-Shot Version: This is the version emphasized in introductory level courses. In this version the dominant strategy is for both players to defect.
- Repeated Game Version #1: In this version of the Prisoner's Dilemma the players will play the game for an a priori known, finite number of rounds. The result...since the last round is in essence a one-shot game, mutual defection is the dominant strategy. Since both players know this, they will find it optimal to defect in the next to last round, this dynamic devolves all the way back to the beginning. The strategy of mutually defection still rules in this version.
- Repeated Game Version #2: In this version of the Prisoner's Dilemma the players will play the game for an infinite number of rounds! In this version mutual cooperation can be sustained as an equilibrium as long as the players care a sufficient amount about future rounds of the game (i.e., their discount factors are not too low).
- Repeated Game Version #3: In this version of the Prisoner's Dilemma the players will play the game for an unknown but finite number of rounds. In this world, which to me is the one that most closely resembles reality, the backwards induction argument used in repeated game version #1 doesn't work. Computational simulations can be explored to understand what ingredients are necessary/sufficient for cooperation to be sustained in the population and in what situations where defectors are able to invade the population.
Brad Delong's Version of Bullard's "Seven Faces of the Peril"...
Check out Brad Delong's interpretation of St. Louis Fed President James Bullard's recent article on the chances of the U.S. experiencing a Japanese-style deflation.
Wednesday, August 4, 2010
Thomas Schelling's Segregation Model...
I am beginning to put together some notes, models, and slides that could be used to teach Economics 101 complexity style. My goal is to come up with material that could be taught to enterprising first year undergraduates...
Lesson One: Micromotives and Macrobehavior ...
...
What does this teach first year undergraduates about economics? I would say a several important things:
Lesson One: Micromotives and Macrobehavior
- People interacting with one another using simple decision rules can generate complex behavioral patterns for society as a whole.
- Use Thomas Schelling's segregation model from 1978 to demonstrate the point
- A nice Java version of the his model can be found here
- The key parameter to play with is the minimum percent of neighbors that an individual prefers to be of the same type as himself (i.e., red, green, poor, rich, smart, dumb...whatever)
What does this teach first year undergraduates about economics? I would say a several important things:
- Economics is a social science: People interact in more ways than simply through the price vector. People interact with one another over time and space, and these interactions are often important determinants of macro behavior.
- Dynamics are an important if one seeks to understand economic behavior.
- Simple behavioral rules at the micro level can engender quite complex, and in this case unintended, behaviors at the macro level.
- Related to point 3, aggregation in social systems can be tricky business!
Quote of the Day...
"In physics you're playing against God, and He doesn't change his laws very often. When you've checkmated Him, He'll concede. In finance, you're playing against God's creatures, agents who value assets based on their ephemeral opinions. They don't know when they've lost, so they keep trying."
-Emanuel Derman
Tuesday, August 3, 2010
Complex Systems Paper of the Day...
Ashraf et al. " Banks, Market Organization, and Macroeconomic Performance: An Agent Based Approach." Following an excellent suggestion from James, this is my first attempt to dig out a simple agent-based model that would be a useful alternative to DSGE. C++ code used in the model can be found here. As mentioned by the authors this model is still probably too stylized too be useful for policy...but for now I am going to try to err on the side of simplicity and then look to build towards more policy oriented models. See abstract below...
"This paper is an exploratory analysis of the role that banks play in supporting what Jevons called the mechanism of exchange. It considers a model economy in which exchange activities are facilitated and coordinated by a self-organizing network of entrepreneurial trading firms. Collectively these firms play the part of the Walrasian auctioneer, matching buyers with sellers and helping the economy to approximate equilibrium prices that no individual is able to calculate. Banks affect macroeconomic performance in this economy because their lending activities facilitate entry of trading firms and also influence their exit decisions. Both entry and exit have conflicting effects on performance, and we resort to computational analysis to understand how these conflicting effects are resolved. Our analysis sheds new light on the conflict between micro prudential bank regulation and macroeconomic stability; under some circumstances the economy performs better when bank regulation pays less attention to micro prudence (ie when capital adequacy ratios are lower and allowable loan-to-value ratios are higher). Related to this, the analysis draws an important difference between "normal" performance of the economy and "worst-case" scenarios; the micro prudence conflicts with macro stability only in the worst-case scenarios."This is the first of many attempts to find the right paper or combination of papers...so if this doesn't fit your fancy...don't worry I will find others...
Sense Talking...
After I get my PhD, I think that I will move to Barbados where I will seek to advise the Governor of its Central Bank...
Monday, August 2, 2010
Interesting Congressional Testimony...
Congressional Testimony by David Colander, Scott Page, Sidney Winter, and V.V. Chari on "Building a Science of Economics for the Real World" (Robert Solow also testified as a part of this panel, and his testimony on DSGE's was the subject of a previous post). Solow, Colander, Page, and Winter discourage the sole use of DSGE models AND provide viable alternatives...Chari's testimony in defense of DSGE's as the ONLY acceptable macroeconomic modeling strategy is ridiculous. Chari fails to address the two major criticisms of the DSGE framework raised by the other panel members:
- DSGE models ignore agent interactions which are crucial if one cares about aggregate macroeconomic dynamics, and
- DSGE models ignore meaningful heterogeneity (to my knowledge the only types of heterogeneity that DSGE models incorporate are ex post random differences in agent endowments and shocks. Ex ante all agents are identical.)
Ridiculous Assertion of the Day...
The following is an excerpt from V.V. Chari's recent congressional testimony:
"All the interesting policy questions involve understanding how people make decisions over time and how they handle uncertainty. All must deal with the effects on the whole economy. So, any interesting model must be a dynamic stochastic general equilibrium model. From this perspective, there is no other game in town. Modern macroeconomic models, often called DSGE models in macro share common additional features. All of them make sure that they are consistent with the National Income and Product Accounts. That is, things must add up. All of them lay out clearly how people make decisions. All of them are explicit about the constraints imposed by nature, the structure of markets and available information on choices to households, firms and the government. From this perspective DSGE land is a very big tent. The only alternatives are models in which the modeler does not clearly spell out how people make decisions. Why should we prefer obfuscation to clarity? My description of the style of modern macroeconomics makes it clear that modern macroeconomists use a common language to formulate their ideas and the style allows for substantial disagreement on the substance of the ideas. A useful aphorism in macroeconomics is: "If you have an interesting and coherent story to tell, you can tell it in a DSGE model. If you cannot, your story is incoherent."This, quite simply, is hogwash.
Ramblings on Micro-foundations, Part III...
David Colander dropping gold nuggets in his recent Congressional Testimony...
"DSGE supporter’s primary argument for using the DSGE model over all other models is based on their model having what they call micro foundations. As we discuss in Colander, et al. (2008) what they call micro foundations are totally ad hoc micro foundations. As almost all scientists, expect macroeconomic scientists, fully recognize, when dealing with complex systems such as the economy, macro behavior cannot be derived from a consideration of the behavior of the components taken in isolation. Interaction matters, and unless one has a model that captures the full range of agent interaction, with full inter-agent feedbacks, one does not have an acceptable micro foundation to a macro model."
Quote of the Day...
"One of J.M. Keynes’s most famous quotes, which economists like to repeat, highlights the power of academic economists. He writes, “the ideas of economists and political philosophers, both when they are right and when they are wrong, are more powerful than is commonly understood. Indeed, the world is ruled by little else. Practical men, who believe themselves to be quite exempt from any intellectual influences, are usually the slaves of some defunct economist. Madmen in authority, who hear voices in the air, are distilling their frenzy from some academic scribbler of a few years back.” (Keynes, 1936: 135) What this quotation misses is the circularity of the idea generating process. The ideas of economists and political philosophers do not appear out of nowhere. Ideas that succeed are those that develop in the then existing institutional structure. The reality is that academic economists, who believe themselves quite exempt from any practical influence, are in fact guided by an incentive structure created by some now defunct politicians and administrators."
-David C. Colander
The Visa Process, Cont'd...
Word of warning to all those would be UK visa holders...do NOT be too proactive in filling out your visa application online as it may be deleted if there is a lag between when you complete the application and when you submit it to the consulate! I filled out my visa application online on 27 June and paid the $311 visa fee, but did not sign up for the required biometric appointment because all supporting documentation must be mailed along with the completed application, passport, and biometrics to the British Consulate within two weeks of the biometrics appointment and I was NOT confident that the University would be able to get me the required CAS document within two weeks. When I finally received the CAS document from the University on 25 July and went to print out my application online and make the biometrics appointment my application had been deleted! I have now re-applied and paid the visa fee again...perhaps I will get a refund but I will not be holding my breath...
Subscribe to:
Posts (Atom)