"Systemic problemsThe whole post (plus all the linked materials) is well worth reading. The above snippet gets at the heart of what I am trying to show with my first year PhD paper. Increasing connectivity in the financial sector (which I am modelling as increasing network density), increases the leverage of financial institutions (either because increasing connectivity lowers borrowing costs, financial institutions are risk averse, etc). Increased leverage makes the financial system fragile and vulnerable to idiosyncratic shocks despite the increased diversification brought about by the additional connectivity.
The currently pressing problems all concern instabilities that have been neglected in stable-with-frictions macro theory. They constitute three themes I discussed in more detail in previous Vox columns (Leijonhufvud, June 2007, January 2009, and July 2009).
- Instability of leverage. Competing to achieve rates of return several times higher than returns in industry, financial institutions were at historically high levels of leverage towards the end of the boom, earning historically minimal risk spreads – and carrying large volumes of assets soon to be revealed as “toxic.”
- Connectivity. In the US, under the Glass-Steagall regulations, the financial system had been segmented into distinct industries each characterized by the type of assets they could invest in and liabilities they could issue. Firms in different industry segments were not in direct competition with each other. Deregulation has dramatically increased connectivity in the global network of financial institutions. The crisis of the American savings and loan industry in the 1980s, although costly enough, was confined to that market segment. The present crisis also started in American home finance but has spread and amplified across the world."
Monday, January 31, 2011
An oldie but goodie ftom Axel Leijonhufvud...
Here is a snippet from an old blog post by one of my favourite economists, Axel Leijonhufvud:
Saturday, January 29, 2011
New Code Posted...
So I have finally worked out the Python code for generating marginal densities of the evolution of output when following the optimal savings policy for the growth model detailed in Chapter 6 of Economic Dynamics. The new graphics for the model from the textbook are below and the code has been posted to my repository (fvi_v2.py).
Simulated Trajectories: Not all that interesting...

Simulated Marginal Densities of Log Output: More interesting...notice the convergence. This is Figure 6.12 from Chapter 6.

Output when following the Optimal Savings Policy: Same plot as before, but know I have added axes labels. This is Figure 6.11 from Chapter 6.

Calculating the Walrasian Auctioneer...
Attention conservation notice: Longish post on the details of a stochastic speculative pricing model from Economic DynamicsSuppose that we live in world where there is a single commodity called wheat, whose price at date t is pt. Due to global warming, weather patterns in this world are quite volatile and as a result the harvest of wheat each period (i.e., production of wheat), Wt, is IID random and drawn from a common density function φ.
Harvests take values in S≡[a,∞), where a>0. The demand for wheat is made up by two groups: gatherers, and farmers. Gatherers' quantity demanded is QG=D(p), where p is the price of fruit. It is assumed that the inverse demand function, D-1(QG)=p(QG), exists, is strictly decreasing and continuous, and satisfies p(QG)→∞, as QG→0.
Farmers are risk neutral and have a special technology, called a barn, where they can store wheat between periods. If farmers purchase It units of wheat on date t, then they will be left with αIt, where α ∈ (0,1), next period. Risk-free interest rate is taken to be zero, so we can write the farmers' expected profits on It units of wheat as:
Et(pt+1)αIt - ptIt = (αEt(pt+1) - pt)It
No-arbitrage requires that :αEt(pt+1) - pt ≤ 0 (1)
There is also a logical constraint that tells us that if our farmers are maximizing expected profits, then if
αEt(pt+1) - pt < 0 implies that It = 0 (2)
Finally, market clearing condition requires that supply of wheat equal demand for wheat. Supply of wheat, Xt, is sum of carryover from farmers, αIt-1, and the current harvest Wt, while demand is D(pt) + It. Thus we get:αIt-1 + Wt = Xt= D(pt) + It (3)
Take the initial condition for supply of wheat, X0 ∈ S as given.
The question now becomes, how does one construct a system (It, pt, Xt)t ≥ 0 for investment, prices, and supply of wheat that satisfies (1-3)? The idea is to find a price function p:S→(0,∞) that depends only on the current state Xt (i.e., pt=p(Xt) for every t). The vector (It, pt, Xt)t ≥ 0 for investment, prices, and supply of wheat would then evolve according to:
I skip over the theory related to solving this system (the solution makes heavy use of Banach's fixed point theorem, consult Economic Dynamics for the details), and jump straight to the numerical solution.
Here is a plot of the pricing function when gatherers' inverse demand function is assumed to follow D-1(QG)=p(QG)=1/QG and the random harvests Wt = a + cBt where the Bt are drawn from a beta distribution Beta(5,5).
 This figure reproduces Figure 6.13 from Economic Dynamics. Once the pricing function has been calculated, it can be used to define a stochastic dynamical system as follows:
The question now becomes, how does one construct a system (It, pt, Xt)t ≥ 0 for investment, prices, and supply of wheat that satisfies (1-3)? The idea is to find a price function p:S→(0,∞) that depends only on the current state Xt (i.e., pt=p(Xt) for every t). The vector (It, pt, Xt)t ≥ 0 for investment, prices, and supply of wheat would then evolve according to:
pt=p(Xt), It = Xt - D(pt), and Xt+1 = αIt + Wt+1 (4)
For a given initial condition for supply of wheat, X0 ∈ S and a exogenous shock process (Wt)t ≥ 1, the system (4) determines the time path of our vector (It, pt, Xt)t ≥ 0 as a sequence of random variables. The idea then is to find a pricing function p such that (1) and (2) hold for the system (4).
I skip over the theory related to solving this system (the solution makes heavy use of Banach's fixed point theorem, consult Economic Dynamics for the details), and jump straight to the numerical solution.
Here is a plot of the pricing function when gatherers' inverse demand function is assumed to follow D-1(QG)=p(QG)=1/QG and the random harvests Wt = a + cBt where the Bt are drawn from a beta distribution Beta(5,5).

Xt+1 = αI(Xt)+ Wt+1
where I(x) = x - D(P*(x)).
I have simulated several trajectories, and marginal densities from this stochastic process.


I have simulated several trajectories, and marginal densities from this stochastic process.

In addition to marginal densities, I also plotted the density of the random harvest. The fact that the marginal densities of the supply of wheat converge to the density of the harvest process indicates that the farmers (who are wheat speculators) do not have any impact on the long-run supply of wheat.

For fun, I also reproduced the above analysis assuming that the harvest follows a Pareto distribution with α=2 (location and scale parameters are the same as those of the Beta distribution above). I find the plots amusing...


Note that, in this case, the marginal densities seem to converge...but not to the density of the harvest process. What does this mean? Well for this parametrization the Pareto distribution has a well defined mean, which implies that there is an "average" harvest (about 10 units in this case), but the variance is infinite! Thus while tomorrows harvest is likely to be close to 10, there is also a non-negligible probability that it could be 10,000. The mean is very much influenced by these large harvests. The median of the distribution, however, is about 7.5. It is almost as if the speculators, because they wake up to below average harvests on most mornings, believe that the best thing to do is try to store wheat and sell it next period.
Any other interpretations? The code is posted to my repository (you will want cpdynam.py and pSolve.py amongst other dependencies).
For those of you following my research...I am playing around with the idea of using the above methods to try to solve for the price of land in the Credit Cycles model. The first thing I will need to endogenize the production side of the above economy. Any strong beliefs about whether this would be a useful way to proceed?
Friday, January 28, 2011
More on the Solow Model...
In working through the material on the version of the Solow model from Chapter 6 of Economic Dynamics (if you want details of the model see previous posts) I began to wonder how an agent living in this world would go about choosing an optimal policy. Here is the answer using U(c) = 1 - exp(-θc):
Iterations of the Value Function:


Iterations of the Value Function:
Note the jump up in the optimal savings policy.
The Optimal Policy:

The plot of output above assumes that the shock takes its average value. You can clearly see the two steady-state levels of output (they occur where the blue line cuts the 45 degree line from above).
I am not quite sure what to make of this...I wasn't expecting the output and the optimal policy lines to cross...maybe a bug in my code. Thoughts and interpretations are welcome! The code has been posted to my Google Code repository. Try it with a different (bounded and continuous) utility function and let me know your results...
I am not quite sure what to make of this...I wasn't expecting the output and the optimal policy lines to cross...maybe a bug in my code. Thoughts and interpretations are welcome! The code has been posted to my Google Code repository. Try it with a different (bounded and continuous) utility function and let me know your results...
Wednesday, January 26, 2011
Today's events...
Things I managed to accomplish today...
- Taught my usual early morning Econ 1 tutorial. This week's topics were on Monopoly and Monopsony.
- Attended and excellent lecture on Spatial Econometrics: Theory and Applications
- Attended the PhD discussion group on recent job market candidates
- Taught MSc Quantitative Methods lab on Maximum Likelihood and Probit models
- Continued writing up my notes on Credit Cycles and attempting to turn out a working model of my extension!
- Another Econ 1 tutorial...
- Participating in a natural language processing experiment in the School of Informatics
- Attend another job market presentation
- Python, Python, and more Python...
- Credit Cycles, Credit Cycles, and more Credit Cycles...
Monday, January 24, 2011
Things I read today...
Some interesting articles that I came across in today's internet wanderings...The article about trends in job creation (or lack thereof!) in the U.S. over the last decade is particularly depressing...
Things to do 24 Jan 2011...
Left over from yesterday...
Prepare to teach Econ 1: Go through assigned problem sets for Chapter 10 on Monopoly and Monopsony- Continue to work through Chapter 6 of Economic Dynamics...will it ever end!
- Run 2 miles...
Grade QM lab submission from last week (Due 25 Jan 2011 15:00)Prepare to teach QM lab on Probit modeling application of maximum likelihood estimation.Teach first Econ 1 tutorial of the week 14:00-16:00- Fill out various registration forms for upcoming economics talks, workshops, and seminars
Coffee (x2)- Attend Python Edinburgh working group meeting 1830-?
Sunday, January 23, 2011
Things to do 23 Jan 2011...
What is on the docket today....
- Prepare for Econ 1 teaching:
Read Chapter 10 on Monopolistic Competition in P&R, work through the assigned problem sets. - Run 2 miles...
Attend job market presentation at 1300Attend possible seminar at 1630?- Continue (finish?) work on Chapter 6 of Economic Dynamics
Coffee (x2)
France v. U.S.: Employment...
Paul Krugman re-hashed an interesting post comparing a key employment stat (percent employment for 25-54 year-olds) for the U.S. and France. I found the graphic particularly compelling, and thought I should reproduce it from the raw OECD data myself...
The first graph is my replication of Krugman's. The graphic suggests that the idea, popular even amongst "well-informed" circles in the U.S., that job prospects in the U.S. are somehow generally superior to those in the "Old-World," is no longer true (France, of course, plays the stereotype of Old Europe). The graphic might support that hypothesis for the early 1980's through 2000, but things seemed to have changed dramatically over the last 10 years...

It is important to note that Krugman expresses the employment percentages as:
I thought that it might be worthwhile to also look at the employment percentages for:

I don't really have a good interpretation of the differences...but thought I would share the figures anyway.
The first graph is my replication of Krugman's. The graphic suggests that the idea, popular even amongst "well-informed" circles in the U.S., that job prospects in the U.S. are somehow generally superior to those in the "Old-World," is no longer true (France, of course, plays the stereotype of Old Europe). The graphic might support that hypothesis for the early 1980's through 2000, but things seemed to have changed dramatically over the last 10 years...

It is important to note that Krugman expresses the employment percentages as:
(No. of employed persons ages 25-54) / (Total population ages 25-54)
I thought that it might be worthwhile to also look at the employment percentages for:
(No. of employed persons ages 25-54) / (Total labour force ages 25-54)
The difference is that, in this case, I am normalizing by the total labour force ages 25-54 (instead of the total population figure). Why? I thought there might be some funny things going on in the persons ages 25-54 who are not looking for work (i.e., included in total population count but not in the labour force count). This graph is below...

I don't really have a good interpretation of the differences...but thought I would share the figures anyway.
No more using GitHub...
After much frustration, I have decided to no longer use gitHub as the repository for my Python code. I have switched to using Google Code. I have started an open-source project repository called PyEconomics, and have uploaded the code I have used in some of my previous blog posts. This project is very much a work in progress.
In the short-run, I plan on using this project as the dumping ground for the code I generate for my PhD thesis. In the long-run, I hope to turn this project into a Python module that can be used in economics teaching and research.
If you would like to contribute to the long-run goals of PyEconomics please contact me!
Friday, January 21, 2011
The Look-Ahead Estimator...
Here is another estimate of the stationary distribution for the version of the Solow growth model detailed in previous posts. Estimation of this stationary distribution was carried out using the Look Ahead estimator detailed in Economic Dynamics: Theory and Computation. Although the Look Ahead estimator has superior sampling properties to NPKDE, I have also included the NPKDE version of the stationary distribution for comparison. I have not yet figured out exactly why the y-axis scales differ (perhaps they are supposed to?). Many thanks to John Stachurski for help working optimizing my implementation of the Look Ahead estimator! Buy his book! Code will be posted to my GitHub Google Code repository tomorrow...


My weekend plans...
My plans for the weekend (in no particular order...):
- Complete Chapter 6 of Economic Dynamics: Theory and Computation
Figure out how GitHub works (Switch to Google Code!)- More Python programming from Programming Collective Intelligence
- Start writing a paper about the benefits of using a programming language like Python in economic research
Climb Arthur's SeatandGo for a hike in the PentlandsBuy groceries...
Thursday, January 20, 2011
The BoE is interested in my area of research...
Andrew Haldane, who is the Bank of England's Executive Director of Financial Stability, and his co-author Robert May have recently published a paper in Nature that focuses on the dangers to the stability of the financial system caused by too much complexity in the structure of financial networks. It is an excellent, easy read and definitely gives the flavour of the major results so far regarding systemic risk and financial network structure.
One of the many insights referenced in the paper is the idea that regulatory policy should take a more systemic approach (as opposed to focusing regulatory policy at the level of the individual institution). This reminded me of a recent post by Cosma Shalizi questioning the need for microfoundations in macroeconomics.
Andrew Haldane will be coming to Edinburgh in March to give a lecture on financial stability, and I will definitely be in attendance...
Tuesday, January 18, 2011
Python Code Posted to GitHub...
After a bit of wrestling with the terminal window, I have now managed to push the Python code that I used to simulate to stochastic version of the Solow model with technology threshold to my GitHub repository. Enjoy!
An ergodic model of economic growth?...
So, I am now thoroughly confused! I now think that perhaps the version of the Solow model outlined in my previous post is actually an Ergodic model! I think this despite the fact that the deterministic version of the same model is (I think) non-Ergodic because it has multiple steady-states and long-run outcomes are completely dependent on initial conditions of capital stock.
Below are estimates of the unique pdf and cdf of steady-state distribution of the Solow model from my previous post (with identical parameter values). John Stachurksi, in his book Economic Dynamics proves that the model is globally stable and thus that the steady-state distribution is unique. Global stability, I think, implies that a process is Ergodic. The distribution was created by simulating the model for 100,000 periods and then estimating the pdf using non-parametric kernel density estimation. The cdf was estimated using an estimator based on the empirical cdf.
Threshold Solow PDF:
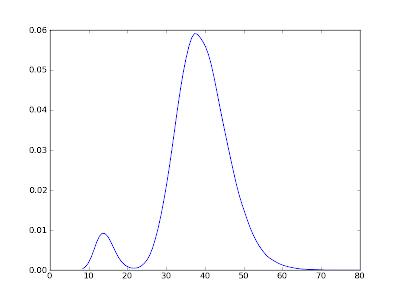 Note that the distribution is double-humped. The reason that the left-hand hump (corresponding to the "poor" attractor) is small relative to the right-hand hump is that the threshold level of capital stock, kb, is such that once the economy moves into the "rich" attractor's basin it is unlikely to get shocked out. If you where to raise the threshold kb, then the left-hand hump would get bigger.
Threshold Solow CDF:
 As promised, I will post a link to Github later today with the Python code...
Below are estimates of the unique pdf and cdf of steady-state distribution of the Solow model from my previous post (with identical parameter values). John Stachurksi, in his book Economic Dynamics
Threshold Solow PDF:

Threshold Solow CDF:

Monday, January 17, 2011
A non-ergodic model of economic growth?...
As part of my ongoing quest to learn more about ergodic theory (and to apply a bit of the Python skills that I have been developing), I have been writing code to implement variations of the Solow model of economic growth using John Stachurski's Economic Dynamics: Theory and Computation as my guide.
Below are some plots of simulations from what I think is a non-Ergodic version of the Solow model. The equation of motion of capital stock in the Solow model is:
 Parameters are defined as follows: α is capital's share in production, s is the savings rate, δ is the rate of capital depreciation. W are shocks which are assumed to be independently and identically log-normal. The twist is that technology A follows a step function:
My choice of parameters was α=0.5, s=0.25, A1=15, A2=25, δ=1.0, kb=21.6, the log-normal shocks have mean 0 and variance 0.2. This parameter choice might seem very specific, but it simply matches with exercises from Stachurski's book.
Time Series Plots: Below is a plot of two time-series drawn from the above model. The initial conditions are k0 = 1.0 (blue) and 80.0 (green). Note the persistence...if you start with low levels of capital stock to begin with it can take a long while to get away from the low attractor. If the system was deterministic, then if you started with low capital stock, you will always have low capital stock. Initial conditions would completely determine long-run outcomes, and we thus have an example of a poverty trap!
 Marginal Distributions: Below is a plot of the empirical distribution function at t=100 time steps. The left-hand plot is for k0 = 1.0 whilst the right-hand plot is for k0 = 80.0. Note that the the distributions differ depending on the initial conditions.
 I will update this post and make the Python code available via GitHub once I have finished working out the code to simulate and solve for the steady-state distribution of this model. I know that it will be double-humped (b/c of the two attractors)...
But just to confirm, is this version of the Solow Model non-Ergodic?
Below are some plots of simulations from what I think is a non-Ergodic version of the Solow model. The equation of motion of capital stock in the Solow model is:
My choice of parameters was α=0.5, s=0.25, A1=15, A2=25, δ=1.0, kb=21.6, the log-normal shocks have mean 0 and variance 0.2. This parameter choice might seem very specific, but it simply matches with exercises from Stachurski's book.

Time Series Plots: Below is a plot of two time-series drawn from the above model. The initial conditions are k0 = 1.0 (blue) and 80.0 (green). Note the persistence...if you start with low levels of capital stock to begin with it can take a long while to get away from the low attractor. If the system was deterministic, then if you started with low capital stock, you will always have low capital stock. Initial conditions would completely determine long-run outcomes, and we thus have an example of a poverty trap!


But just to confirm, is this version of the Solow Model non-Ergodic?
Computability of Nash Equilibria...
An excellent post on the computability of Nash equilibria of normal form games. I quote:
Why should we care about the computability of Nash equilibria? If agents are not able to deduce the Nash equilibria from the payoff matrix, then this cripples game theory as a predictive model of human behaviour (except in the subset of normal form games that are simplistic enough that the Nash equilibrium can be deduced from the payoff matrix by the agents). The question then becomes: How well do simplistic normal form games map to real world decisions?
"Bottom line: Rational players can reason about and make use of Nash’s rational prediction, but they cannot deduce it. The prediction should somehow magically pop up in their minds."I particularly like the author's reference to a paragraph of John Nash's doctoral thesis that hints at the issue. Apparently this paragraph never made it into the published version of the thesis. Here is a Google Scholar link to a bunch of other papers on the subject...
Why should we care about the computability of Nash equilibria? If agents are not able to deduce the Nash equilibria from the payoff matrix, then this cripples game theory as a predictive model of human behaviour (except in the subset of normal form games that are simplistic enough that the Nash equilibrium can be deduced from the payoff matrix by the agents). The question then becomes: How well do simplistic normal form games map to real world decisions?
Sunday, January 16, 2011
The dangers of high frequency trading...
I am becoming increasingly convinced that high frequency trading represents a significant de-stabilizing influence on stock markets. I do not buy the idea that high frequency trading strategies simply improve informational efficiency in the markets (by eliminating minute price differentials between buyers and sellers) and provide extra liquidity to the market when it is needed. I happen to think that these high-frequency trading algorithms and electronic trading strategies destabilize the market. How? I have no firm idea. Just the intuition that such strategies increase the frequency and density of interactions between market participants and that perhaps this is not a good thing...also it may be the case that by driving down buy-sell spreads HFTs force institutional investors to pursue other more risky strategies to make higher returns (i.e., mutual funds, pension funds, etc may increase their leveraged positions in order to compete with HFTs or something similar).
Here is the link to the SEC report on the "flash crash" that took place in May 2010. The report details how the interaction between high-frequency trading algorithms and electronic trading strategies implemented by structural traders (i.e., a particular mutual fund complex) where main causes of the flash crash. Here are some links to recent articles and blog posts that go into more detail on the issue.
Here is the link to the SEC report on the "flash crash" that took place in May 2010. The report details how the interaction between high-frequency trading algorithms and electronic trading strategies implemented by structural traders (i.e., a particular mutual fund complex) where main causes of the flash crash. Here are some links to recent articles and blog posts that go into more detail on the issue.
Saturday, January 15, 2011
Crieff PhD Presentations...
My research presentation at Crieff two days ago was hugely successful. I presented the material well (to a packed audience), my research was well received, and most importantly I received excellent feedback from my discussant, my PhD supervisor, and the audience. By far my most successful presentation so far...
I will post again soon about what I plan to do next once I finalize my research plans a bit more...
I will post again soon about what I plan to do next once I finalize my research plans a bit more...
Wednesday, January 12, 2011
Making the most of 15 mins of free wifi in Paris...
Blogging from Paris CDG Airport in route to Edinburgh for my second PhD semester. Travel tips for those of you heading to the UK or Europe anytime soon...avoid connecting flights through London at all costs! Connect through an airport on the continent. I prefer to connect through Paris, but Amsterdam was also nice.
London (particularly Heathrow) is to be avoided...bad Juju...
London (particularly Heathrow) is to be avoided...bad Juju...
Tuesday, January 11, 2011
Jon Stewart on the recent events in Arizona...
I thought I would share this clip of Jon Stewart discussing the recent shooting in Arizona...hopefully those readers in the UK can view it...
| The Daily Show With Jon Stewart | Mon - Thurs 11p / 10c | |||
| Arizona Shootings Reaction | ||||
| ||||
Python on the rise in finance...
Nice article about the rise of Python in quantitative finance. Apparently the SEC has put forward a proposal that requires most asset-backed securities issuers to file a Python computer program to model and document the flow of funds (or waterfall) provisions associated with the transaction.
Needless to say, continuing to improve my Python capabilities is at the top of my list of things to do over the next term...
Needless to say, continuing to improve my Python capabilities is at the top of my list of things to do over the next term...
Do economists need a code of conduct?...
Yes. If you are taking money from an organization whose goals or agenda might influence your research then this should be disclosed...
Will Web 2.0 kill "Homo-Economicus"...
The following is a very quickly written, poorly formulated post that hopefully contains a few nuggets of insight that I can develop later...
I would like to point to a couple of recent posts shared by Brad Delong. These posts on Google, Facebook, and the future of certain aspects of Web 2.0, have a major theme in common: they focus on the utility of social networks in optimizing not just search results but an individual's entire Internet experience. Facebook, it seems, believes that this idea has the potential to revolutionize, not only the internet, but non-internet industries as well...
Perhaps I am wrong, but these companies (i.e., Google, Facebook, and other Web 2.0 companies) seem to be making a huge amount of money by developing technologies based around a theory of human behavior that is fundamentally at odds with neoclassical "homo-economicus" economic theory. Web 2.0 technologies are based around the idea that individuals care about what other people care about, that individuals exist within a social structure, and that this social structure influences individuals' preferences and thus their decision making. These technologies are facilitating a type of decentralized social/collective decision making...
What is current in price theory...
I second this call from Robert Vienneau. Where can one find the canonical statement of a current theory of prices?
Some of friends of mine are keen to form a price theory discussion group when I get back to Edinburgh, and I suspect that they are going to focus on more mainstream (i.e., Arrow-Debreu style) price theory. I would like to contribute something as an alternative...but what?
Some of friends of mine are keen to form a price theory discussion group when I get back to Edinburgh, and I suspect that they are going to focus on more mainstream (i.e., Arrow-Debreu style) price theory. I would like to contribute something as an alternative...but what?
Sunday, January 9, 2011
Content Clustering in Econ Blogs...
Below is a dendrogram that I created using after applying a hierarchical clustering algorithm to the recent content of a set of economics blogs. I used average linkage hierarchical clustering to compare blogs based on the correlation of the vectors of word counts used in their most recent blog posts (i.e., blogs that used the same words lots of times will be listed as "similar" with this implementation).
The blog content was obtained by scraping the RSS feeds of blogs listed in the Gongol directory (plus a few others that I read that weren't listed therein). Because I scraped the RSS feeds, I am only comparing blogs by the content of their most recent post (and not the total history of posts). The fact that this clustering is obtained using only the most recent blog posts means that you can't really interpret much from the dendrogram. However if I built a database to store blog content and then re-ran this analysis everyday for a lengthy period of time you would hope that the clustering would settle down and become stable.
There are many ways that this methodology could be improved upon and if I have some time I may pursue them a bit further...
I have posted a .jpeg...unfortunately it is unreadable. You will need to download it and open it in a viewer if you want to see where your favorite economics blog ended up. I ended up close to Greg Mankiw...which was unexpected!
Monday, January 3, 2011
My latest distraction arrived today...
My copy of Programming Collective Intelligence: Building Smart Web 2.0 Applications arrived in the mail today. I am fairly confident (more so after reading that Cosma Shalizi et al have recently received a grant from INET to apply these techniques to validate macroeconomic forecasting models) that the programming techniques taught in this book will be useful to me as a macroeconomist.
I am particularly interested in the techniques borrowed from statistical and machine learning theory (support-vector machines, genetic algorithms, genetic programming, etc).
I am particularly interested in the techniques borrowed from statistical and machine learning theory (support-vector machines, genetic algorithms, genetic programming, etc).
Sunday, January 2, 2011
Subscribe to:
Posts (Atom)