Typically, we economists model firms as choosing demands for capital and labor in order to maximize profits while taking prices as given (i.e., unaffected by the decisions of the individual firm):\[\max_{K,L} \Pi = K^{\alpha}(AL)^{1 - \alpha} - (wL + rK)\] where the prices are $1, w, r$. Note that I am following convention in assuming that the price of the output good is the numeraire (i.e., normalized to 1) and thus the real wage, $w$, and the return to capital, $r$, are both relative prices expressed in terms of units of the output good.
The first order conditions (FOCs) of a typical firms maximization problem are \[\begin{align}\frac{\partial \Pi}{\partial K}=&0 \implies r = \alpha K^{\alpha-1}(AL)^{1 - \alpha} \label{MPK}\\
\frac{\partial \Pi}{\partial L}=&0 \implies w = (1 - \alpha) K^{\alpha}(AL)^{-\alpha}A \label{MPL}\end{align}\] Dividing $\ref{MPK}$ by $\ref{MPL}$ (and a bit of algebra) yields the following equation for the optimal capital/labor ratio: \[\frac{K}{L} = \left(\frac{\alpha}{1 - \alpha}\right)\left(\frac{w}{r}\right)\] The fact that, for a given set of prices $w$, $r$, the optimal choices of $K$ and $L$ are indeterminate (any ratio of $K$ and $L$ satisfying the above condition will do) implies that the optimal scale of the firm is also indeterminate.
How can I create a graphic that clearly demonstrates this property of the CRTS production function? I can start by fixing values for the wage and return to capital and then creating contour plots of the production frontier and the cost surface.
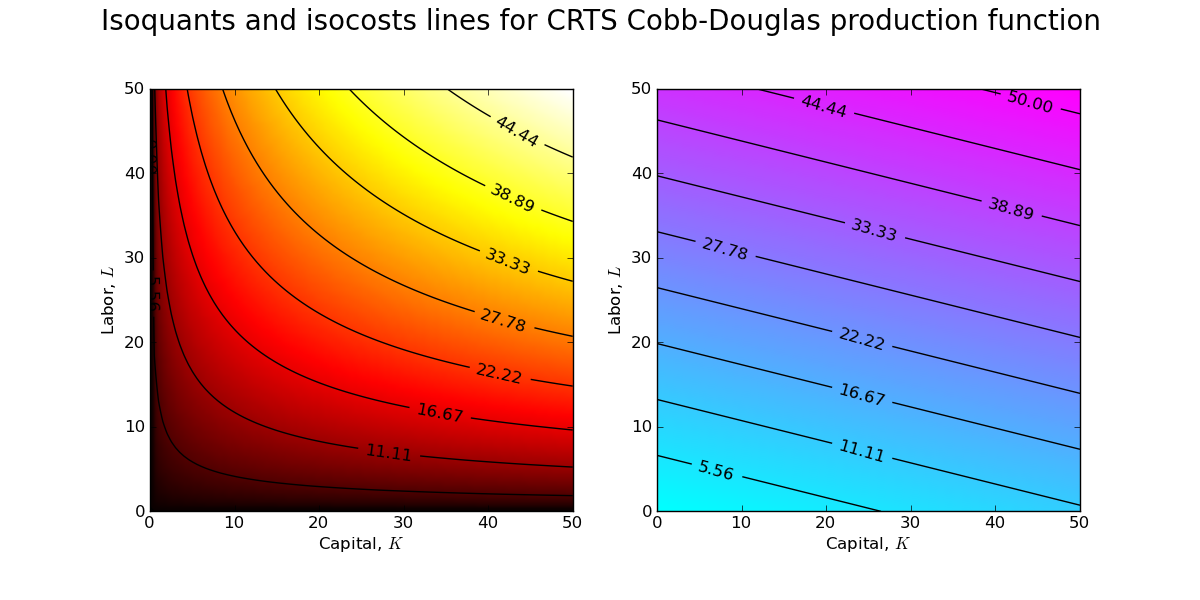

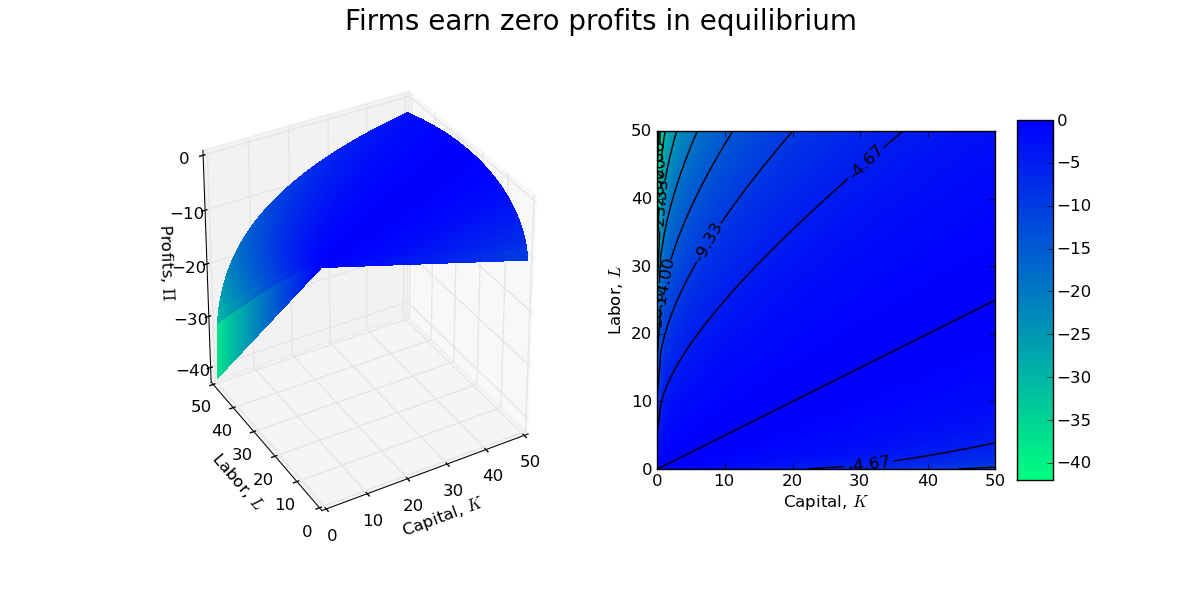
A firm manager is indifferent between each of these points of tangency, and thus the size/scale of the firm is indeterminate. Indeed, with CRTS a firm will earn zero profits at each of the tangency points in the above contour plot.
As usual, the code is available on GitHub.
Update: Installing MathJax on my blog to render mathematical equations was easy (just a quick cut and paste job).
No comments:
Post a Comment