Blog Topics...

3D plotting (1) Academic Life (2) ACE (18) Adaptive Behavior (2) Agglomeration (1) Aggregation Problems (1) Asset Pricing (1) Asymmetric Information (2) Behavioral Economics (1) Breakfast (4) Business Cycles (8) Business Theory (4) China (1) Cities (2) Clustering (1) Collective Intelligence (1) Community Structure (1) Complex Systems (42) Computational Complexity (1) Consumption (1) Contracting (1) Credit constraints (1) Credit Cycles (6) Daydreaming (2) Decision Making (1) Deflation (1) Diffusion (2) Disequilibrium Dynamics (6) DSGE (3) Dynamic Programming (6) Dynamical Systems (9) Econometrics (2) Economic Growth (5) Economic Policy (5) Economic Theory (1) Education (4) Emacs (1) Ergodic Theory (6) Euro Zone (1) Evolutionary Biology (1) EVT (1) Externalities (1) Finance (29) Fitness (6) Game Theory (3) General Equilibrium (8) Geopolitics (1) GitHub (1) Graph of the Day (11) Greatest Hits (1) Healthcare Economics (1) Heterogenous Agent Models (2) Heteroskedasticity (1) HFT (1) Housing Market (2) Income Inequality (2) Inflation (2) Institutions (2) Interesting reading material (2) IPython (1) IS-LM (1) Jerusalem (7) Keynes (1) Kronecker Graphs (3) Krussel-Smith (1) Labor Economics (1) Leverage (2) Liquidity (11) Logistics (6) Lucas Critique (2) Machine Learning (2) Macroeconomics (45) Macroprudential Regulation (1) Mathematics (23) matplotlib (10) Mayavi (1) Micro-foundations (10) Microeconomic of Banking (1) Modeling (8) Monetary Policy (4) Mountaineering (9) MSD (1) My Daily Show (3) NASA (1) Networks (46) Non-parametric Estimation (5) NumPy (2) Old Jaffa (9) Online Gaming (1) Optimal Growth (1) Oxford (4) Pakistan (1) Pandas (8) Penn World Tables (1) Physics (2) Pigouvian taxes (1) Politics (6) Power Laws (10) Prediction Markets (1) Prices (3) Prisoner's Dilemma (2) Producer Theory (2) Python (29) Quant (4) Quote of the Day (21) Ramsey model (1) Rational Expectations (1) RBC Models (2) Research Agenda (36) Santa Fe (6) SciPy (1) Shakshuka (1) Shiller (1) Social Dynamics (1) St. Andrews (1) Statistics (1) Stocks (2) Sugarscape (2) Summer Plans (2) Systemic Risk (13) Teaching (16) Theory of the Firm (4) Trade (4) Travel (3) Unemployment (9) Value iteration (2) Visualizations (1) wbdata (2) Web 2.0 (1) Yale (1)
Showing posts with label Santa Fe. Show all posts

Thursday, June 7, 2012

5-6 June 2012 at the 2012 CSSS...

For the past two days the focus has been on tools for analyzing non-linear dynamical (and specifically chaotic) systems.   We have been using a program called TISEAN to do most of the analysis.  There also seem to be a number of R packages for doing non-linear times series analysis: RTisean, tsDyn, tseriesChaos, etc.

Henon Map:  

Our first task was to simply use TISEAN to generate some trajectories of the Henon map, plot them using our favorite plotting tool (at the moment I am working on improving my Python coding so I am using matplotlib) and then analyze the power spectrum (sometimes called spectral density).  TISEAN's version of the Henon map is:

xt+1 = 1 - Axt2 + Byt
yt+1 = xt

For A=0.8 and B=0, the attractor is a simple 2-cycle which means that a plot of the trajectory of the map in state space will yield two points:
 However, for A=1.4 and B=0.3, the Henon map displays chaotic dynamics:
Power Spectrum: A good place to start the analysis of times series data is to examine the power spectrum (or spectral density) of the data.   For the Henon map with A=0.8 and B=0, the attractor is a 2-cycle which implies that the dominant frequency should be 1/2.  
Note the above plot has a single "spike" at a frequency of 0.5.  What other frequencies are present in the times series generated by the Henon map?  Given that the map is a 2-cycle, in theory, there should be only a single frequency present in the data.  Although my computer can represent much smaller numbers, the smallest number that my computer can distinguish as being distinct (i.e., my machine ε) is 2.2204460492503131e-16.  The other "spikes" in the above plot are thus non-sensical results of my computer doing calculations with numbers that are too small for it to handle properly.  This is a good example of arithmetic underflow.

Given that the Henon map with A=1.4 and B=0.3 exhibits chaotic dynamics we expect that the power spectrum should exhibit spikes at all frequencies.

The Lorenz System: 

Next we want to plot some trajectories the Lorenz System and then analyze the resulting power spectrums.  Classic model of chaos developed by Edward Lorenz to model weather/climate systems.  For parameter values R=15, S=16, B=4 the system exhibits a unique fixed point attractor...
...or in 3D if you prefer:
The power spectrum for the unique fixed point attractor looks as follows:
One gets much more interesting dynamics out of the Lorenz system simply by changing R.  For parameter values R=45, S=16, B=4 the system exhibits chaos:
For R=45, the power spectrum exhibits power at all frequencies:

Python code (and the data files if you do not have TISEAN installed) for replicating the above can be found here.

Monday, June 4, 2012

Monday 4 June 2012 at the 2012 CSSS...

Today's lecture, given by Prof. Liz Bradley, focused on the basics of non-linear (mostly chaotic) dynamics in both discrete and continuous time.  Much (all?) of the material in the lecture I had already encountered before in my own reading, but it was nice to get a refresher.  What follows is my summary of our discussion of the dynamical properties of that classic example of chaotic dynamics in discrete time, the logistic map.  The seminal reference for the logistic map is probably the 1976 Nature paper by Robert May.

The Logistic Map is an innocent looking non-linear equation:

Xt+1 = r Xt (1 - Xt)

where the state space of the model is the unit interval [0, 1] and r is a parameter that varies on (0, 4].  

Some trajectories of the logistic map for various values of r:
If  0 < r ≤ 1, then the dynamics are trivial: the model will converge to X = 0 no matter the initial condition.  Suppose the r = 2.  In this case, the dynamics of the model are also pretty boring: convergence to a unique fixed point.  No matter the initial condition, if r = 2, all trajectories of the logistic map will converge (quite quickly) on a unique steady state value of 1/2.

Now suppose that r = 2.919149.  In this case, the result is still convergence to a unique fixed point, however the dynamics are more interesting: the trajectories now exhibit dampened oscillations.
For values of r satisfying 3 < r < 3.45 (roughly!), you get a 2-cycle:
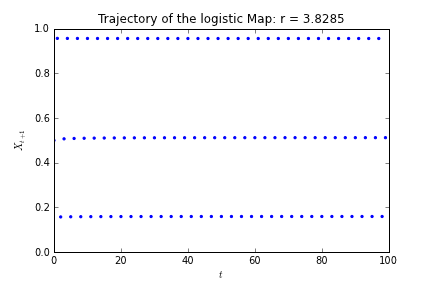
For r = 3.8285, one gets the famous 3-cycle which is one of the generally accepted indicators of chaotic dynamics (note I have changed the initial condition from 0.2 to 0.5 to eliminate the transient and thus making the cobweb diagram a bit cleaner):
Finally, for r = 4 we get an example of chaotic dynamics.  Note that the deterministic trajectory for the logistic map looks incredibly "random."
3D plot of the phase space for the logistic map:
One of the reasons why models with chaotic dynamics, such as the logistic map, exhibit sensitive dependence to initial conditions, is that such maps repeatedly "stretch and fold" the state space over which they are defined.  While 2D phase plots give a sense of how the logistic map "stretches" the state space,  a 3D phase plot is a really cool way to see how the logistic map "folds" the state space.
If you are interested, the Python code to replicate the above graphics can be found here.  I am still working on the code for the bifurcation diagram, estimating Feigenbaum's constant, and for calculating Lyapunov exponents.  

Thursday, March 1, 2012

Santa Fe bound!

I have just received notification that I have been accepted into the 2012 Complex Systems Summer School at the Santa Fe Institute!  Attending the Santa Fe institute's summer school has been a dream of mine ever since I was made aware of its existence some 6 years ago...

Tuesday, March 1, 2011

Rejected for this year's Santa Fe CSSS...

Just found out that my application to this year's Santa Fe CSSS has been rejected.  Not sure what to say...attending the Santa Fe Institute's complex systems summer school has been a dream of mind ever since I was made aware of its existence.  I thought I had a really strong package.  I wrote a strong, and topical research proposal on computational approaches to studying financial networks with an eye towards systemic risk analysis, and I had excellent references (including a reference from a Santa Fe external faculty member).  The only thing that my application next year might have that is different is some publications (although given the time lags in publishing in economics journals even this is doubtful).

I think what frustrates me the most is that I started my PhD with a strong desire to do exactly the type of interdisciplinary research that has made the Santa Fe Institute so famous, and I feel like I am not off to a good start in this regard.  I was really hoping that Santa Fe would provide some much needed interaction with other researchers who thought and talked about the economy in the same way that I do.  For the most part I can't even get anyone at Edinburgh to acknowledge that networks can be a useful modelling tool to study complex economic interdependencies, much less that networks themselves might play an important role in economic activity.  I don't even attempt to mention complex systems...accept when I am in the School of Informatics...

OK, I am done ranting...now I need to decide whether or not I should bother applying (really gathering the additional references) for the Graduate Workshop in Computational Social Sciences...deadline is March 18th...only 10 spots are available...

Sunday, December 5, 2010

Just Finished Some Summer School Apps...

I just finalized my application for the Sante Fe Summer School on Complex Systems, and my application for a summer internship at the World Bank...this still leaves my applications for internships at the IMF and the Federal Reserve to finish.  If I fail to get accepted to the Sante Fe Summer School, I am going to apply to the Sante Fe Program on Computational Social Sciences as well...

Anyone else have ideas for summer internships?

Tuesday, November 30, 2010

Complexity Catastrophes...

On the train down to Oxford I read through almost all of the proceedings from the original Sante Fe Conference on economics as a complex system.  I found the following chapters to be particularly useful for economists:
  1. The Evolution of Economic Webs, Stuart Kaufman
  2. Persistent Oscillations and Chaos in Economic Models, Michele Boldrin
  3. Self-Reinforcing Mechanisms in Economics, W. Brian Arthur
  4. Computation and Multiplicity of Economic Equilibria, Timothy J. Kehoe
  5. Rational Expectations, Game Theory and Inflationary Inertia, Mario Henrique Simonsen
  6. The Global Economy as an Adaptive Process, John H. Holland
Of the above chapters, Kaufman's on the evolution of economic webs is by far the most thought-provoking.  I am particularly fond of his ideas on complexity catastrophes, as they parallel some of my own ideas on the dangers posed by overly dense connectivity in financial networks.