Blog Topics...

3D plotting (1) Academic Life (2) ACE (18) Adaptive Behavior (2) Agglomeration (1) Aggregation Problems (1) Asset Pricing (1) Asymmetric Information (2) Behavioral Economics (1) Breakfast (4) Business Cycles (8) Business Theory (4) China (1) Cities (2) Clustering (1) Collective Intelligence (1) Community Structure (1) Complex Systems (42) Computational Complexity (1) Consumption (1) Contracting (1) Credit constraints (1) Credit Cycles (6) Daydreaming (2) Decision Making (1) Deflation (1) Diffusion (2) Disequilibrium Dynamics (6) DSGE (3) Dynamic Programming (6) Dynamical Systems (9) Econometrics (2) Economic Growth (5) Economic Policy (5) Economic Theory (1) Education (4) Emacs (1) Ergodic Theory (6) Euro Zone (1) Evolutionary Biology (1) EVT (1) Externalities (1) Finance (29) Fitness (6) Game Theory (3) General Equilibrium (8) Geopolitics (1) GitHub (1) Graph of the Day (11) Greatest Hits (1) Healthcare Economics (1) Heterogenous Agent Models (2) Heteroskedasticity (1) HFT (1) Housing Market (2) Income Inequality (2) Inflation (2) Institutions (2) Interesting reading material (2) IPython (1) IS-LM (1) Jerusalem (7) Keynes (1) Kronecker Graphs (3) Krussel-Smith (1) Labor Economics (1) Leverage (2) Liquidity (11) Logistics (6) Lucas Critique (2) Machine Learning (2) Macroeconomics (45) Macroprudential Regulation (1) Mathematics (23) matplotlib (10) Mayavi (1) Micro-foundations (10) Microeconomic of Banking (1) Modeling (8) Monetary Policy (4) Mountaineering (9) MSD (1) My Daily Show (3) NASA (1) Networks (46) Non-parametric Estimation (5) NumPy (2) Old Jaffa (9) Online Gaming (1) Optimal Growth (1) Oxford (4) Pakistan (1) Pandas (8) Penn World Tables (1) Physics (2) Pigouvian taxes (1) Politics (6) Power Laws (10) Prediction Markets (1) Prices (3) Prisoner's Dilemma (2) Producer Theory (2) Python (29) Quant (4) Quote of the Day (21) Ramsey model (1) Rational Expectations (1) RBC Models (2) Research Agenda (36) Santa Fe (6) SciPy (1) Shakshuka (1) Shiller (1) Social Dynamics (1) St. Andrews (1) Statistics (1) Stocks (2) Sugarscape (2) Summer Plans (2) Systemic Risk (13) Teaching (16) Theory of the Firm (4) Trade (4) Travel (3) Unemployment (9) Value iteration (2) Visualizations (1) wbdata (2) Web 2.0 (1) Yale (1)
Showing posts with label Macroeconomics. Show all posts

Saturday, January 12, 2013

Welfare costs of business cycles and models with heterogenous agents...

Start of quasi literature review for a heterogenous agents project I am starting in the near future.  I will continue to update this post as I come across/finish reading additional papers...comments or links to important paper are welcome!

Literature:

Lucas (2003): Robert Lucas' Presidential Address given at the 2003 AEA conference in which he summarizes and defends his back-of-the-envelope calculation of the welfare costs of business cycles.  Good, gentle introduction to the literature.  Includes a good reference list and brief discussion of the the Krusell and Smith (2002) working paper.

Barlevy (2004):
This article reviews the literature on the cost of U.S. post-War business cycle fluctuations. I argue that recent work has established this cost is considerably larger than initial work found. However, despite the large cost of macroeconomic volatility, it is not obvious that policymakers should have pursued a more aggressive stabilization policy than they did. Still, the fact that volatility is so costly suggests stable growth is a desirable goal that ought to be maintained to the extent possible, just as policymakers are currently required to do under the Balanced Growth and Full Employment Act of 1978. This survey was prepared for the Economic Perspectives, a publication of the Federal Reserve Bank of Chicago.
As boring an abstract as you will ever come across. Includes a nice table summarizing various estimates of the cost of business cycles.

Krusell and Smith (1998):
How do movements in the distribution of income and wealth affect the macroeconomy? We analyze this question using a calibrated version of the stochastic growth model with partially uninsurable idiosyncratic risk and movements in aggregate productivity. Our main finding is that, in the stationary stochastic equilibrium, the behavior of the macroeconomic aggregates can be almost perfectly described using only the mean of the wealth distribution. This result is robust to substantial changes in both parameter values and model specification. Our benchmark model, whose only difference from the representative-agent framework is the existence of uninsurable idiosyncratic risk, displays far less cross-sectional dispersion and skewness in wealth than U.S. data. However, an extension that relies on a small amount of heterogeneity in thrift does succeed in replicating the key features of the wealth data. Furthermore, this extension features aggregate time series that depart significantly from permanent income behavior.
Krusell and Smith (1999):
We investigate the welfare effects of eliminating business cycles in a model with substantial consumer heterogeneity. The heterogeneity arises from uninsurable and idiosyncratic uncertainty in preferences and employment, where, regarding employment, we distinguish among employment and short- and long-term unemployment. We calibrate the model to match the distribution of wealth in U.S. data and features of transitions between employment and unemployment. Unlike previous studies, we study how business cycles affect different groups of consumers. We conclude that the cost of cycles is small for almost all groups and, indeed, is negative for some.
Krebs (2004):
This paper analyzes the welfare costs of business cycles when workers face uninsurable idiosyncratic labor income risk. In accordance with the previous literature, this paper decomposes labor income risk into an aggregate and an idiosyncratic component, but in contrast to the previous literature, this paper allows for multiple sources of idiosyncratic labor income risk. Using the multi-dimensional approach to idiosyncratic risk, this paper provides a general characterization of the welfare cost of business cycles when preferences and the (marginal) process of individual labor income in the economy with business cycles are given. The general analysis shows that the introduction of multiple sources of idiosyncratic risk never decreases the welfare cost of business cycles, and strictly increases it if there are cyclical fluctuations across the different sources of risk. Finally, this paper also provides a quantitative analysis of multi-dimensional labor income risk based on a version of the model that is calibrated to match U.S. labor market data. The quantitative analysis suggests that realistic variations across two particular dimensions of idiosyncratic labor income risk increase the welfare cost of business cycles by a substantial amount.
I study the welfare cost of business cycles in a complete-markets economy where some people are more risk averse than others. Relatively more risk-averse people buy insurance against aggregate risk, and relatively less risk-averse people sell insurance. These trades reduce the welfare cost of business cycles for everyone. Indeed, the least risk-averse people benefit from business cycles. Moreover, even infinitely risk-averse people suffer only finite and, in my empirical estimates, very small welfare losses. In other words, when there are complete insurance markets, aggregate fluctuations in consumption are essentially irrelevant not just for the average person—the surprising finding of Lucas [Lucas, Jr., R.E., 1987. Models of Business Cycles. Basil Blackwell, New York] but for everyone in the economy, no matter how risk averse they are. If business cycles matter, it is because they affect productivity or interact with uninsured idiosyncratic risk, not because aggregate risk per se reduces welfare.  
Krusell et al. (2009):
We investigate the welfare effects of eliminating business cycles in a model with substantial consumer heterogeneity. The heterogeneity arises from uninsurable and idiosyncratic uncertainty in preferences and employment status. We calibrate the model to match the distribution of wealth in U.S. data and features of transitions between employment and unemployment. In comparison with much of the literature, we find rather large effects. For our benchmark model, we find welfare effects that, on average across all consumers, are of a bit more than one order of magnitude larger than those computed by Lucas [Lucas Jr., R.E., 1987. Models of Business Cycles. Basil Blackwell, New York]. When we distinguish long- from short-term unemployment, long-term unemployment being distinguished by poor (and highly procyclical) employment prospects and low unemployment compensation, the average gain from eliminating cycles is as much as 1% in consumption equivalents. In addition, in both models, there are large differences across groups: very poor consumers gain a lot when cycles are removed (the long-term unemployed as much as around 30%), as do very rich consumers, whereas the majority of consumers—the “middle class”—sees much smaller gains from removing cycles. Inequality also rises substantially upon removing cycles.
The above paper has a 2002 working paper that seems to come to different conclusions about the welfare costs of business cycles.  Technical appendices are also provided.

Wednesday, January 2, 2013

Graph of the Day

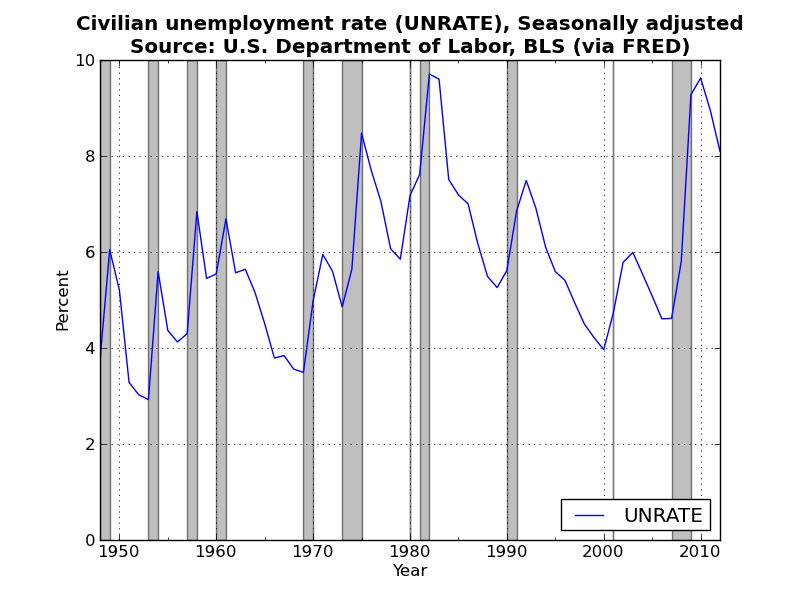
A busy day (actually trying to do a bit of my own research!)...so I just threw together a plot of the historical civilian unemployment rate using FRED data (similar to figure 1-3 from Mankiw's intermediate macroeconomics textbook).  Very boring I know, but tomorrow I promise something a bit more interesting!

If anyone can point me in the direction of the actual data that Mankiw uses to generate the graphs from his textbook I would be very grateful. I can't seem to find it! Code for the above is available on GitHub.

Monday, December 31, 2012

Graph of the Day

Today's graphic is motivated by recent posts by Paul Krugman on implications of capital-biased technological change.  In both posts Krugman uses the share of employee compensation (COE) to nominal GDP as his measure of labor's share of income.  Although the data for both series go back to 1947, Krugman chooses to drop the data prior to 1973 arguing that 1973 marked the end of the post-WWII economic boom.  Put another way, Krugman is saying that there is a structural break in the data generating process for labor's share which makes data prior to 1973 useless (or perhaps actively misleading) if one is interested in thinking about future trends in labor share.

If you are wondering what a plot of the entire time series looks like here is the ratio of COE / GDP from 1947 forward.
It looks like the employee compensation ratio is roughly the same today as it was in 1950 (although obviously heading in different directions!).

In his first post Krugman argues that this measure "fluctuates over the business cycle."  Note that the vertical scale ranges only from 0.52 to 0.60. Such a small range will exacerbate fluctuations in the series.  Plotting the same data on its natural scale (i.e.,  0 to 1), yields the following.
Based on this plot, the measure appears to have been remarkably constant over the past 60 odd years.

Which of these plots gives the more "correct" view of the data? Or does it depend on the point you are trying to make?

As always, code is available.

Friday, December 28, 2012

Graph of the Day

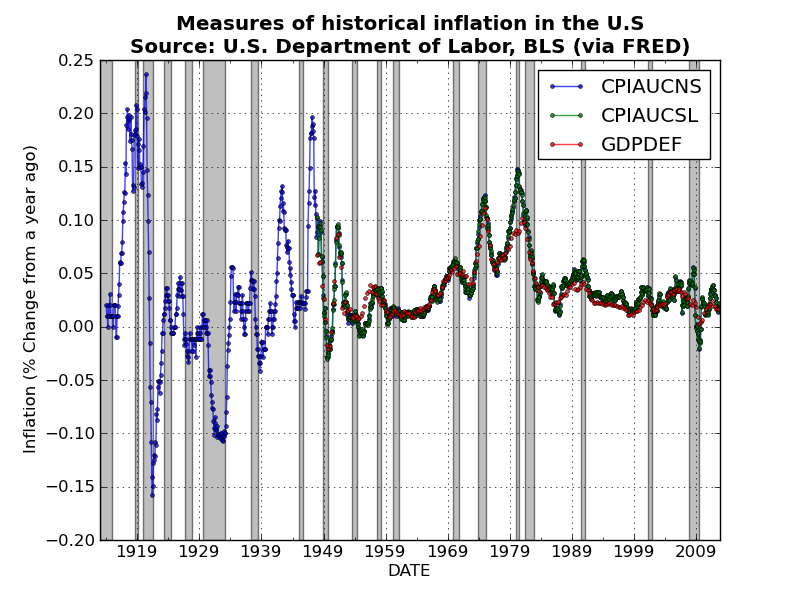
Took a few days off blogging for Christmas and Boxing Day, but am now back at it! Here is a quick plot of historical measures of inflation in the U.S..  I used Pandas to grab the three price indices, and then used a nice built-in Pandas method pct_change(periods)to convert the monthly price indices (i.e., CPIAUCNS and CPIAUCSL) and the quarterly GDP deflator to measures of percentage change in prices from a year ago (which is a standard measure of inflation).  

After combining the three series into a single DataFrame object, you can plot all three series with a single line of code!
Unsurprisingly the three measures track one another very closely.  Perhaps I should have thrown in some measures of producer prices? Code is available here.

Wednesday, December 19, 2012

Blogging to resume again!

It has been far too long since my last post.  Life (becoming a father), travel (summer research trip to SFI), teaching (am teaching a course on Computational Economics), and research (also trying to finish my PhD!) have a way of getting in the way of my blogging.  As a mechanism to slowly move back into the blog world, I have decided to start a 'Graphic of the Day' series.  Each day I will create a new economic graphic using my favorite Python libraries (mostly Pandas, matplotlib, NumPy/Scipy).

The inaugural  'Graph of the Day' is Figure 1-1 from Mankiw's intermediate undergraduate textbook Macroeconomics.

Real GDP measures the total income of everyone in the economy, and real GDP per person measures the income of the average person in the economy.  The figure shows that real GDP per person tends to grow over time and that this normal growth is sometimes interrupted by period of declining income (i.e., the grey NBER bars!), called recessions or depressions.

Note that Real GDP per person is plotted on a logarithmic scale.  On such a scale equal distances on the vertical axis represent equal percentage changes. This is why the distance between \$8,000 and \$16,000 (a 100% increase) is the same as the distance between \$32,000 and \$64,000 (also a 100% increase).

The Python code is available on GitHub for download (I used pandas.io.data.get_data_fred() to grab the data).  The graphic is a bit boring.  I was a bit depressed to find that the longest time series for U.S. per capita real GDP only goes back to 1960! This seems a bit scandalous...but perhaps I was just using the wrong data tags!

Wednesday, August 10, 2011

Scary Thought for the Day...

So I have been watching CNBC the past few days (and have been surprised to find much of the commentary reasonably informative!).  Over the past week, investors have seen the U.S. Government's credit rating cut from AAA to AA+ by S&P.  Following the downgrade these investors have seen wild swings in global equities markets, with the result that large numbers of investors have been piling in to U.S. Treasuries pushing interest rates down even further!  So far the "market" seems to think the credit of the U.S. Government is still pretty solid.  Listening to the coverage of media speculation that France was going to have its sovereign rating slashed from AAA to some other combination of letters and +/- signs, the following scary thought occurred to me...

 Suppose that investors start start thinking the following:
  1. The U.S. Government bond is still the safest, most risk-free asset around.
  2. S&P is correct in their assessment that the U.S. Government no longer deserves a AAA credit rating.
If you believe 1) and 2), then do you conclude that no other government bonds, say for France, Germany, Netherlands, Luxembourg, Austria, Finland etc can be AAA either?  If investors start to believe this in mass, then interest rates for one or more of the above countries may rise, which will increase debt burdens, which could cause one or more of the above countries to receive a downgrade, and the cycle would continue...

This would be a very bad self-fulfilling prophecy for the Euro zone.

Monday, May 23, 2011

The yield curve as a recession indicator...

According to a couple of recent papers from the N.Y. Federal Reserve, the magnitude of the yield curve at the end of monetary policy tightening cycles is an excellent predictor of whether or not the economy will end up in recession within 24 months following the end of the tightening cycle. 

The earlier paper (Adrian and Estrella, 2009) documents the empirical result, while the later paper (Adrian, Estrella, and Shin, 2010) provides a plausible causal mechanism that has its roots in balance sheet management by financial intermediaries.  The idea in (Adrian, Estrella, and Shin, 2010) is that when monetary tightening is associated with a flattening of the term spread (i.e., the gap between yields on 10 year U.S. government bonds and short-term Treasury bills becomes sufficiently small), it reduces net interest margins (NIM) for financial intermediaries.  This reduction in NIM makes lending less profitable, which leads to a contraction in the supply of credit. 

The plot above is slightly different than the one reproduced in both of the above papers.  The difference is that I used the difference between GS10, 10-year U.S. government bonds (constant maturity), and TB3MS, 3-month T-bills (secondary market rate), to construct my yield curve. 

The authors above use a constant maturity 3-month T-bill rate.  I choose the secondary market rate because the data series went back further.  It is possible (likely) that the secondary market rates are systematically higher than the corresponding constant maturity rates.  So compared with the authors measure,  my measure of the term spread is likely to be narrower.

I don't know which method of constructing the term spread is preferable...but Greg Mankiw uses the same method!   I will post my R-code (and data) for constructing the above plots soon...

Tuesday, April 12, 2011

True or False...

The following question was inspired by Larry Summers claim at the recent INET conference that microfounded, DSGE-style models played no role in informing policy making during the recent financial crisis.
Is there an important distinction to be made between the type of microfoundations used in DSGE modelling and the type of microfoundations used in the incomplete markets/contracting literature? or are they effectively the same?
(I am aware that this is not actually a True or False question...)

Larry Summers at Bretton Woods...

Entertaining interview with Larry Summers about the problems in macroeconomics from the recent INET conference in Bretton Woods, NH.


I have become sceptical of sweeping critiques of economics. Fortunately, Summers, doesn't make any such criticisms. He rightly points out that there is a vast literature, both old and modern, on bank runs, liquidity provision, the relationship between liquidity and asset price inflation, the importance of credit, and the relationship between all of the above and real macroeconomic performance.

About 22 mins into the interview Summers expounds upon topics that, from his perspective as a policy maker, have been under-developed in the academic literature. Very fruitful ground for any PhD students looking for policy-relevant topics for dissertations...

Monday, March 28, 2011

Financial Intermediation...

Another brilliant segment from the recent IMF conference on Financial Intermediation.  I particularly recommend the last two speakers: Hyun Song Shin (who comes on at about 45 minutes) and Adair Turner of the FSA (who follows Prof. Shin).


Update: Check out the Q&A session.  Adair Turner makes some very interesting remarks about high-frequency/algorithmic trading.  In particular, he questions their social value by first supposing that such algorithms are not destabilizing in and of themselves, and then asking the audience to consider under these ideal circumstances whether or not they are really necessary as a price discovery mechanism or whether they provide liquidity in a socially useful way.

Wednesday, March 16, 2011

Brilliant set of videos from the IMF...

Below I have embedded the videos for the the first two sessions (the rest can be found by following the link) of the recent IMF conference on "Macro and Growth Policies in the Wake of the Crisis."  I haven't watched all of the videos (actually only in the middle of the first session on monetary policy), but thought I would share anyway...

Session I: Monetary Policy


Session II: Fiscal Policy


A summary of Olivier Blanchard's summary of the conference: In what follows things in bold and italics are a mixture of my emphasis and Blanchard's.  If you don't care what I think is important just follow the previous link...
  1. We’ve entered a brave new world in the wake of the crisis; a very different world in terms of policy making and we just have to accept it. 
  2. In the age-old discussion of the relative roles of markets and the state, the pendulum has swung—at least a bit—toward the state. 
  3. The crisis made it clear that there are many distortions relevant for macroeconomics, many more than we thought earlier. We had ignored them, thinking they were the province of the micro-economist. As we integrate finance into macroeconomics, we’re discovering distortions within finance are macro-relevant. Agency theory—about incentives and behavior of entities or “agents”—is needed to explain how financial institutions work or do not work and how decisions are taken. Regulation and agency theory applied to regulators is important. Behavioral economics and its cousin, behavioral finance, are central as well. 
  4. Macroeconomic policy has many targets and many instruments (that is, the tools we use or variables to implement policy). There are many examples of this that were discussed at the conference 
  5. We may have many policy instruments, but we are not sure how to use them. In many cases, we are uncertain about what they are, how they should be used, and whether or not they will work. Again, many examples came up during the conference.
    1. We don’t quite know what liquidity is, so a liquidity ratio is one more step into the unknown.
    2. It was clear that some people believe capital controls work and some don’t. 
    3. Paul Romer made the point that, if you adopt a set of financial regulations and keep them unchanged, the markets will find a way around, and ten years later, you’ll have a financial crisis. 
    4. Mike Spence talked about the relative roles of self-regulation and regulation. Both are needed, but how we combine them is extremely unclear. 
  6. While these instruments are potentially useful, their use raises a number of political economy issues. 
  7. Where do we go from here? In terms of research, the future is exciting. There are many topics on which we should work—namely macro issues with, as Joe Stiglitz said, the right micro foundations. 
  8. Things are harder on the policy front. Given we don’t quite know how to use the new tools and they can be misused, how should policymakers proceed? While we have a good sense of where we want to get to, a step-by-step approach is the way to do it. Pragmatism is of the essence. This was a general theme that came up, for example, in Andrew Sheng’s discussion of the adaptive Chinese growth model. We have to try things carefully and see how they work. 
  9. We have to keep our hopes in check. There are going to be new crises that we have not anticipated. And, despite our best efforts, we could have old-type crises again. That was a theme in Adair Turner’s discussion of credit cycles. Can we, using agency theory and the right regulations, get rid of credit cycles? Or is it basic human nature that, no matter what we do, they will come back in some form?

Sunday, February 27, 2011

Fiscal Policy and Macroeconomics...

Interesting panel discussion on fiscal policy from February's MIT's 150 anniversary symposium.  I particularly enjoyed Olivier Blanchard's remarks on the Eurozone debt crisis and the recent currency dispute between China and the U.S. 

Blanchard looked a bit uncomfortable during the question and answer segment when panel moderator Ricardo Caballero tried to get him to speculate about what might happen if the Eurozone was unable to address their debt issues fast enough for the "markets" and a new crisis took hold.

I suppose it is unwise to prod the Chief Economist at the IMF to speculate about what might happen if countries the IMF is currently loaning billions of dollars to were to effectively default on those obligations.

Monday, February 21, 2011

Advanced Macroeconomics...

Today I had my first lecture in advanced topics in macroeconomics.  The lecture was good, and focused on several basic versions of over-lapping generations models.  What really caught my attention, however, was this paper on endogenous business cycles by J.M. Grandmont that was listed in the recommended reading for the course.

I am almost finished with my a major draft of my first year paper (I hope to be finished sometime tomorrow) at which point I will send it off to my supervisor and Prof. Moore for comments and feedback.  Once I have finished the draft I think I will spend a couple of days really going through the Grandmont paper and writing some blog posts summarizing some of the key ideas...

Thursday, February 17, 2011

Watson, Machine Learning, and Macroeconomics...

Nice video about the recent Jeopardy competition involving and IBM computer called Watson...


Question: Would it be useful to apply techniques from machine learning to model the macroeconomy? Cosma Shalizi has been awarded a grant from INET for research in this area...which I take to be a good sign.  Any opinions about this? Or links to share?

Monday, February 14, 2011

Ashamed to admit it, but...

Today I went through a properly rigorous mathematical treatment of the basic IS-LM model for the first time.  Alpha Chiang gives an excellent treatment of the IS-LM framework in his Fundamental Methods of Mathematical Economics.

I am embarrassed to say that this is my first time going through IS-LM!  I assume that this would be something that a second (or maybe even first) year undergraduate would have encountered.  I am only slightly absolved because I never studied undergraduate economics.  It was covered, very briefly, in my MSc at the University of Edinburgh.  However it wasn't stressed as being useful, and we weren't examined on it.

Having spent my entire day going through increasingly sophisticated versions of IS-LM, I feel pretty good.  I feel like I learned quite a bit about how the macroeconomy works.  I pose to my readers the following question: Why is it that some economists believe that IS-LM has been discredited?

I take as given that the economists in question are extremely intelligent and have thought deeply about the issues involved...so there must be some other reason.  I was actually surprised that a Google search for: IS-LM "discredited" turned up (for the most part) fairly positive articles.  If anyone has what they think is a convincing refutation of the IS-LM framework I would appreciate it if you send a pointer in my direction!

I will be teaching a very basic (and non-mathematical) version of the model in first year macroeconomics in a few weeks...

Update: Sean passed Tyler Cowen's critique of IS-LM to me via email.  My quick take on Tyler's critiques: points 1 and 4 are well taken.  Point 2 (and to a lesser extent point 5) would seem to implicitly assume that investment decisions are made solely on the basis of real and not nominal variables.

Friday, January 28, 2011

More on the Solow Model...

In working through the material on the version of the Solow model from Chapter 6 of Economic Dynamics (if you want details of the model see previous posts) I began to wonder how an agent living in this world would go about choosing an optimal policy.  Here is the answer using U(c) = 1 - exp(-θc):

Iterations of the Value Function:

Note the jump up in the optimal savings policy.  

The Optimal Policy:
The plot of output above assumes that the shock takes its average value.  You can clearly see the two steady-state levels of output (they occur where the blue line cuts the 45 degree line from above). 

I am not quite sure what to make of this...I wasn't expecting the output and the optimal policy lines to cross...maybe a bug in my code.  Thoughts and interpretations are welcome!  The code has been posted to my Google Code repository.  Try it with a different (bounded and continuous) utility function and let me know your results...

Monday, January 3, 2011

My latest distraction arrived today...

My copy of Programming Collective Intelligence: Building Smart Web 2.0 Applications arrived in the mail today.  I am fairly confident (more so after reading that Cosma Shalizi et al have recently received a grant from INET to apply these techniques to validate macroeconomic forecasting models) that the programming techniques taught in this book will be useful to me as a macroeconomist.

I am particularly interested in the techniques borrowed from statistical and machine learning theory (support-vector machines, genetic algorithms, genetic programming, etc).

Tuesday, December 14, 2010

Back to Python and Markov Chains...

So I am back to programming in Python and working my way through Economic Dynamics: Theory and Computation.  I am in the middle of Chapter 4 at the moment and have just written some basic code for simulating the Markov-switching model of unemployment from Hamilton (2005).  I highly recommend a read of the paper.  It is fairly short, contains a neat little model, and after reading it I felt like I had a greater understanding of the dynamics of unemployment and the business cycle...

I will continue to work on the code over the holidays, and will push my it out to github for others to use...after I get my github repository set up!

Saturday, November 20, 2010

Ergodic Theory: A Verbal Monte-Carlo...

An interesting verbal example, a verbal monte-carlo if you will based on a post by Robert Vienneau.  I suspect one of my macro profs Sevi will like about ergodic and non-ergodic processes goes as follows:

Suppose I observe the consumption sample paths of 10,000 individuals over 10,000 units of time.  Let us also now make the completely implausible assumption that these 10,000 consumption paths were generated by the sample process.  Suppose that I pluck one sample path and look at the distribution across time.  Now suppose that I pluck out the observation at t=350 from each of the 10,000 sample paths and look at the distribution.  If this process was ergodic, then these two distributions should converge to one another in large enough samples. 

With ergodic processes, distributions across time and distributions across people should be the statistically the same (in large samples).  If the process is non-ergodic, then the distribution across people at a given moment in time and the distribution across time will not converge.  Sevi always comments about how summing (aggregating) across people, and summing across time are not always equivalent statements...is this the same as saying that economic processes in such cases are non-ergodic?  I don't know. 

Now let's go back and relax the ridiculous assumption that all agents have the same process that determines there consumption.  With heterogeneous agents even if each agent individually is following an ergodic process, the aggregate distributions across agents and across time will be a mixture of ergodic processes and therefore must be non-ergodic (I think).

Whether or not the above mentioned processes are stationary or non-stationary and why is still a mystery to me.  In Vienneau's example, the process he used in his actual monte-carlo was stationary but non-ergodic. 

Friday, November 19, 2010

Musings on Ergodic Theory...

There comes a time in every man's life where he feels that he should know more about ergodic theory than he does, for me that time arrived at 2:30 pm this afternoon while reading Brian Arthur's Increasing Returns and Path Dependence in the Economy

First I would like to prove to myself that Cosma Shalizi's assertions in this post are in fact correct.  Specifically he claims that...
"It is not true that non-stationarity is a sufficient condition for non-ergodicity; nor is it a necessary one."
This says that non-stationarity does not imply non-ergodicity.  I want to prove this by contradiction, so I need an example of a non-stationary process that is ergodic.
"It is not true that 'positive destabilizing feedback' implies non-ergodicity."
Again to prove by contradiction, I need an example of an ergodic process that exhibits positive destabilizing feedback 
"It is not true that ergodicity is incompatible with sensitive dependence on initial conditions."
Here I need an example of an ergodic process that exhibits sensitive dependence to initial conditions.  Cosma has already pointed out in his post that chaotic processes will generally serve as an example of an ergodic process with sensitive dependence on initial conditions
"It is not true that ergodicity rules out path-dependence, at least not the canonical form of it exhibited by Arthur's models"
Finally, I will need an example of an ergodic process that also exhibits path-dependence. 

I am currently reading Scott Page's essay on path dependence and I suspect that I will be able find several of the examples that I will need included in the text.

While all of this might seem very far removed from economics, I think understanding all of the above will provide useful constraints on the types of macroeconomic modelling techniques that I should pursue...at least this is my hope.