Blog Topics...

3D plotting (1) Academic Life (2) ACE (18) Adaptive Behavior (2) Agglomeration (1) Aggregation Problems (1) Asset Pricing (1) Asymmetric Information (2) Behavioral Economics (1) Breakfast (4) Business Cycles (8) Business Theory (4) China (1) Cities (2) Clustering (1) Collective Intelligence (1) Community Structure (1) Complex Systems (42) Computational Complexity (1) Consumption (1) Contracting (1) Credit constraints (1) Credit Cycles (6) Daydreaming (2) Decision Making (1) Deflation (1) Diffusion (2) Disequilibrium Dynamics (6) DSGE (3) Dynamic Programming (6) Dynamical Systems (9) Econometrics (2) Economic Growth (5) Economic Policy (5) Economic Theory (1) Education (4) Emacs (1) Ergodic Theory (6) Euro Zone (1) Evolutionary Biology (1) EVT (1) Externalities (1) Finance (29) Fitness (6) Game Theory (3) General Equilibrium (8) Geopolitics (1) GitHub (1) Graph of the Day (11) Greatest Hits (1) Healthcare Economics (1) Heterogenous Agent Models (2) Heteroskedasticity (1) HFT (1) Housing Market (2) Income Inequality (2) Inflation (2) Institutions (2) Interesting reading material (2) IPython (1) IS-LM (1) Jerusalem (7) Keynes (1) Kronecker Graphs (3) Krussel-Smith (1) Labor Economics (1) Leverage (2) Liquidity (11) Logistics (6) Lucas Critique (2) Machine Learning (2) Macroeconomics (45) Macroprudential Regulation (1) Mathematics (23) matplotlib (10) Mayavi (1) Micro-foundations (10) Microeconomic of Banking (1) Modeling (8) Monetary Policy (4) Mountaineering (9) MSD (1) My Daily Show (3) NASA (1) Networks (46) Non-parametric Estimation (5) NumPy (2) Old Jaffa (9) Online Gaming (1) Optimal Growth (1) Oxford (4) Pakistan (1) Pandas (8) Penn World Tables (1) Physics (2) Pigouvian taxes (1) Politics (6) Power Laws (10) Prediction Markets (1) Prices (3) Prisoner's Dilemma (2) Producer Theory (2) Python (29) Quant (4) Quote of the Day (21) Ramsey model (1) Rational Expectations (1) RBC Models (2) Research Agenda (36) Santa Fe (6) SciPy (1) Shakshuka (1) Shiller (1) Social Dynamics (1) St. Andrews (1) Statistics (1) Stocks (2) Sugarscape (2) Summer Plans (2) Systemic Risk (13) Teaching (16) Theory of the Firm (4) Trade (4) Travel (3) Unemployment (9) Value iteration (2) Visualizations (1) wbdata (2) Web 2.0 (1) Yale (1)

Monday, December 24, 2012

Graph(s) of the Day!

Today's graphic(s) attempt to dispel a common misunderstanding of basic probability theory. We all know that flipping a fair coin will result in heads exactly 50% of the time.  Given this, many people seem to think that the Law of Large Numbers (LLN) tells us that the observed number of heads should more or less equal the expected number of heads. This intuition is wrong!

A South African mathematician named John Kerrich was visiting Copenhagen in 1940 when Germany invaded Denmark. Kerrich spent the next five years in an interment camp where, to pass the time, he carried out a series of experiments in probability theory...including an experiment where he flipped a coin by hand 10,000 times! He apparently also used ping-pong balls to demonstrate Bayes theorem.

After the war Kerrich was released and published the results of many of his experiments. I have copied the table of the coin flipping results reported by Kerrich below (and included a csv file on GitHub). The first two collumns are self explanatory, the third column, Differenceis the difference between the observed number of heads and the expected number of heads.
TossesHeadsDifference
104-1
20100
30172
40211
50250
6029-1
7032-3
8035-5
9040-5
10044-6
20098-2
300146-4
400199-1
5002555
60031212
70036818
80041313
9004588
10005022
2000101313
3000151010
4000202929
5000253333
600030099
7000351616
8000403434
9000453838
10000506767
Below I plot the data in the third column: the difference between the observed number of heads and the expected number of heads is diverging (which is the exact opposite of most peoples' intuition)! 

Perhaps Kerrich made a mistake (he didn't), but we can check his results via simulation! First, a single replication of T = 10,000 flips of a fair coin...

Again, we observe divergence (but this time in the opposite direction!).  For good measure, I ran N=100 replications of the same experiment (i.e., flipping a coin T=10,000 times).  The result is the following nice graphic...

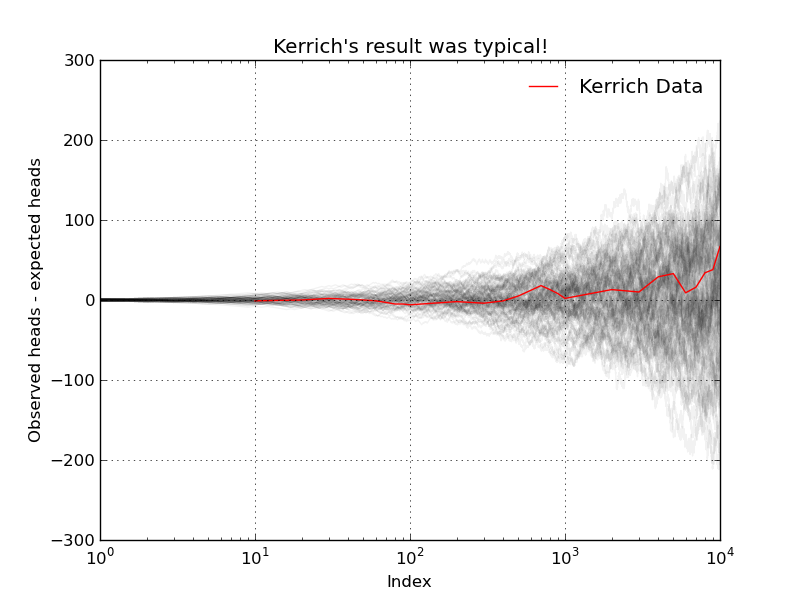
Our simulations suggest that Kerrich's result was indeed typical. The LLN does not say that as T increases the observed number of heads will be close to the expected number of heads! What the LLN says instead is that, as T increases, the average number of heads will get closer and closer to the true population average (which in this case, with our fair coin, is 0.5). 
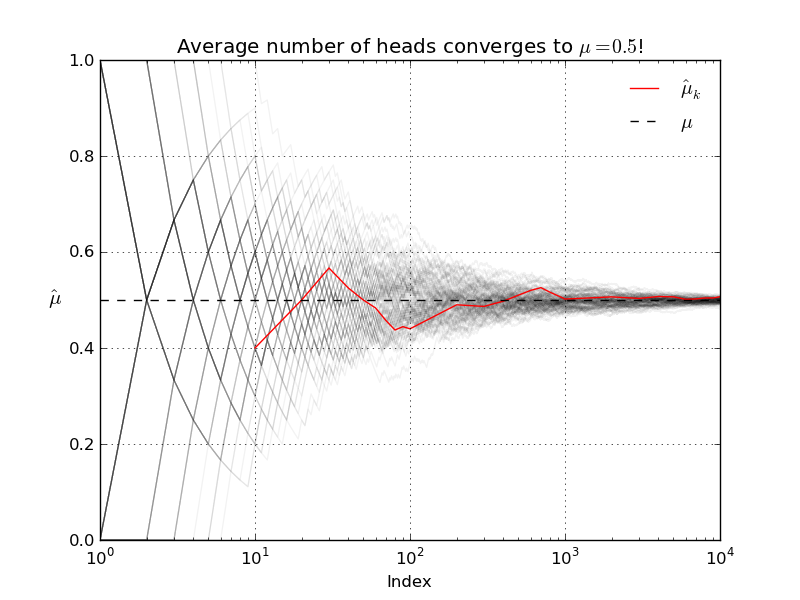
Let's run another simulation to verify that the LLN actually holds. In the experiment I conduct N=100 runs of T=10,000 coin flips.  For each of the runs I re-compute the sample average after each successive flip.
As always code and data are available! Enjoy.

No comments:

Post a Comment