Blog Topics...

3D plotting (1) Academic Life (2) ACE (18) Adaptive Behavior (2) Agglomeration (1) Aggregation Problems (1) Asset Pricing (1) Asymmetric Information (2) Behavioral Economics (1) Breakfast (4) Business Cycles (8) Business Theory (4) China (1) Cities (2) Clustering (1) Collective Intelligence (1) Community Structure (1) Complex Systems (42) Computational Complexity (1) Consumption (1) Contracting (1) Credit constraints (1) Credit Cycles (6) Daydreaming (2) Decision Making (1) Deflation (1) Diffusion (2) Disequilibrium Dynamics (6) DSGE (3) Dynamic Programming (6) Dynamical Systems (9) Econometrics (2) Economic Growth (5) Economic Policy (5) Economic Theory (1) Education (4) Emacs (1) Ergodic Theory (6) Euro Zone (1) Evolutionary Biology (1) EVT (1) Externalities (1) Finance (29) Fitness (6) Game Theory (3) General Equilibrium (8) Geopolitics (1) GitHub (1) Graph of the Day (11) Greatest Hits (1) Healthcare Economics (1) Heterogenous Agent Models (2) Heteroskedasticity (1) HFT (1) Housing Market (2) Income Inequality (2) Inflation (2) Institutions (2) Interesting reading material (2) IPython (1) IS-LM (1) Jerusalem (7) Keynes (1) Kronecker Graphs (3) Krussel-Smith (1) Labor Economics (1) Leverage (2) Liquidity (11) Logistics (6) Lucas Critique (2) Machine Learning (2) Macroeconomics (45) Macroprudential Regulation (1) Mathematics (23) matplotlib (10) Mayavi (1) Micro-foundations (10) Microeconomic of Banking (1) Modeling (8) Monetary Policy (4) Mountaineering (9) MSD (1) My Daily Show (3) NASA (1) Networks (46) Non-parametric Estimation (5) NumPy (2) Old Jaffa (9) Online Gaming (1) Optimal Growth (1) Oxford (4) Pakistan (1) Pandas (8) Penn World Tables (1) Physics (2) Pigouvian taxes (1) Politics (6) Power Laws (10) Prediction Markets (1) Prices (3) Prisoner's Dilemma (2) Producer Theory (2) Python (29) Quant (4) Quote of the Day (21) Ramsey model (1) Rational Expectations (1) RBC Models (2) Research Agenda (36) Santa Fe (6) SciPy (1) Shakshuka (1) Shiller (1) Social Dynamics (1) St. Andrews (1) Statistics (1) Stocks (2) Sugarscape (2) Summer Plans (2) Systemic Risk (13) Teaching (16) Theory of the Firm (4) Trade (4) Travel (3) Unemployment (9) Value iteration (2) Visualizations (1) wbdata (2) Web 2.0 (1) Yale (1)

Friday, December 28, 2012

Graph of the Day

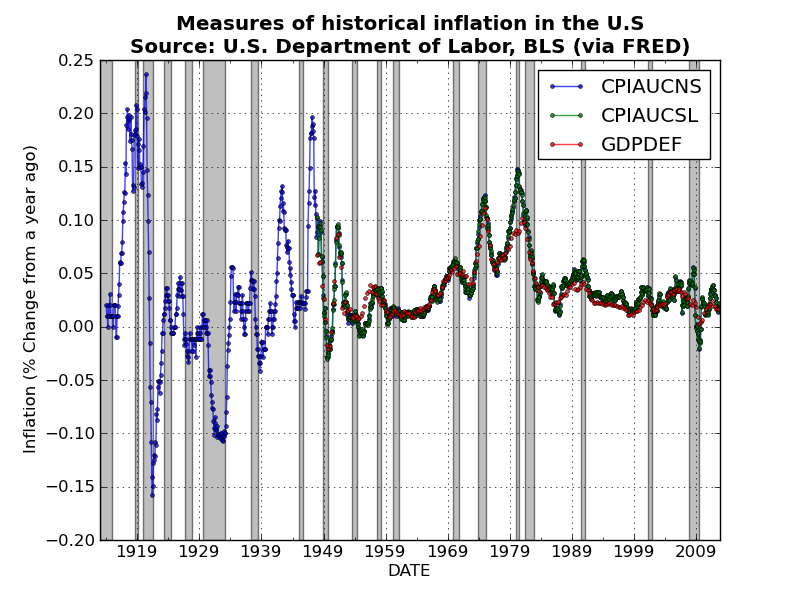
Took a few days off blogging for Christmas and Boxing Day, but am now back at it! Here is a quick plot of historical measures of inflation in the U.S..  I used Pandas to grab the three price indices, and then used a nice built-in Pandas method pct_change(periods)to convert the monthly price indices (i.e., CPIAUCNS and CPIAUCSL) and the quarterly GDP deflator to measures of percentage change in prices from a year ago (which is a standard measure of inflation).  

After combining the three series into a single DataFrame object, you can plot all three series with a single line of code!
Unsurprisingly the three measures track one another very closely.  Perhaps I should have thrown in some measures of producer prices? Code is available here.

No comments:

Post a Comment